Terminal protection solutions or Intrusion Detection Systems (IDS) can detect malicious events based on heuristic methods, signature codes, and artificial intelligence in new solutions. They generate alerts through email, Syslog, Webhooks, or other means. However, effectively analyzing these alert messages to identify and respond to potential threats requires advanced tools and methods.
This article discusses how the IOTA network traffic capture and analysis solution enables security professionals to analyze IDS alert messages, thereby enhancing network security to a new level.
One, Traffic Capture
The first step is to capture the affected traffic. There are two options for capturing network traffic with IOTA: inline or through a SPAN connection. If we have permanently deployed IOTA, we can immediately perform retroactive analysis of traffic patterns after an alert occurs. The placement of IOTA in the network must be determined based on the expected application.
II. Traffic Analysis
Our analysis process depends on whether the message is from an Endpoint Detection and Response (EDR) system or an Intrusion Detection System (IDS). Therefore, we describe various methods for analyzing security alerts.
III. Searching for 'Patient Zero'
Definition of Terms: In the field of network security, 'Patient Zero' is an important concept used to describe the first user or device infected with malicious software or a virus. Its identification and defense are crucial for controlling the spread of malware.
The first step in retroactive analysis is to select the required time window. We can select an absolute time window (from one time to another) or a time window relative to the current time in the upper right corner of the IOTA interface. The time window should be as limited as possible to simplify subsequent analysis.
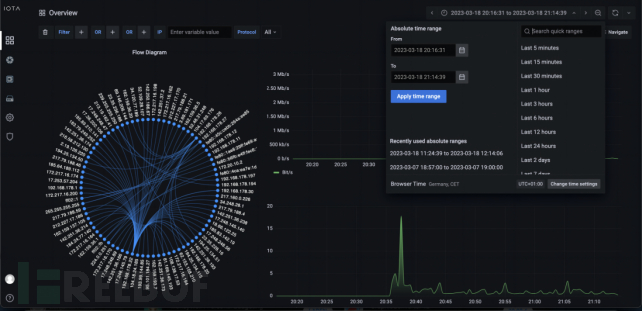
Figure 1: Applying relative or absolute time filters on the IOTA dashboard
We start searching for the attacker from the affected host. Let's start from the host where the attack or abnormal behavior was first detected, find the so-called 'Patient Zero', and limit the time window accordingly.
If it is a known attack, we can specifically search for communication patterns, such as specific target ports. We take this as an example. We assume that a file server is under ransomware attack, the server provides services through the Server Message Block (SMB) in the network. The server's IPv4 address is 192.168.178.6.
We know that SMB runs on TCP port 445, so we filter the target port. This indicates that only the 192.168.178.22 client established an SMB connection with the file server within the encrypted time window.
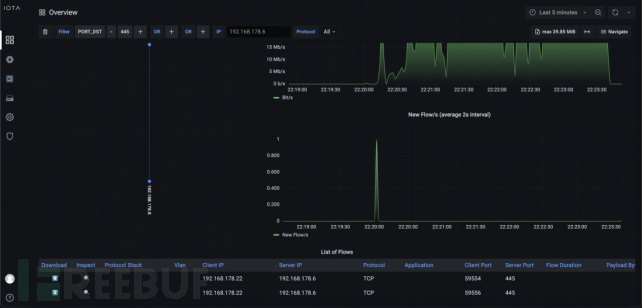
Figure 2: View filtered by destination port 445 and IP address 192.168.178.6. The traffic diagram has also been filtered.
Here, we use the filter 'IP_SRC = 192.168.178.22' to check which communication relationships the client 192.168.178.22 has established recently, and to clarify whether it is command and control traffic or download traffic.
Prior to this, only one communication relationship had left the internal network, specifically, a TCP connection using TLS on the target port 443, that is, HTTPS. Here, we used IOTA's download feature to download the entire data stream and the corresponding data stream. Now, we can check the TLS extension server name indication (SNI) in the client hello to clearly identify which hostname the client used to establish the connection.
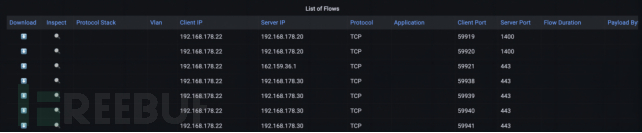
Figure 3: Traffic list on the Overview dashboard. We can download it in PCAPNG format to view specific traffic in detail, or select the '+' symbol for inclusion filtering, or select the '-' symbol for exclusion filtering
Since TLS encryption, the download itself cannot be identified in plain text, so further analysis of the client must be done in the log file. This indicates that the user downloaded and installed a malicious program and then encrypted the files through the analyzed SMB network share.
These steps provide us with the IP address, hostname, and files that caused the attack. However, in some cases, the server that downloads malware is just the attacker's 'front-end server', and they also change occasionally.
However, since lateral movement in the network is usually identifiable in attack events, other clients should also be checked because the affected clients may have already distributed malware. If external communication relationships cannot be identified on the affected clients, all internal communication patterns should be checked for any anomalies that may bring malware to client 192.168.178.22.
To first identify which remote stations the host has communicated with, we can enter the 'Overview' dashboard and then click on the IP address in the flowchart. Then, IOTA will apply an IP filter with source and destination addresses to the clicked IP address.
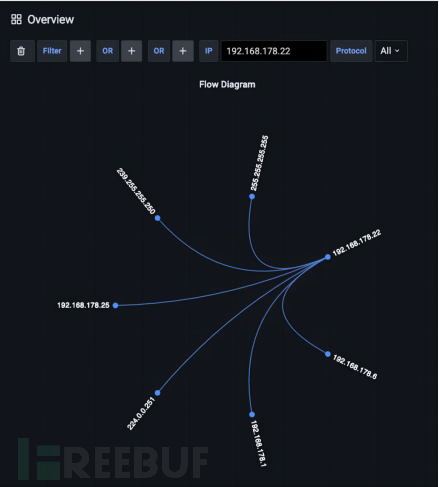
Figure 4: Filtering by IP address and viewing captured traffic
In this diagram, we can see two flows. We can then identify several communication patterns based on IPv4. In the example, the host communicates with six other addresses, one of which is a broadcast address (255.255.255.255), and 192.168.178.1 is the gateway. We can also see multicast addresses 224.0.0.251 and 239.255.255.250. This leaves only 192.168.178.6 and 192.168.178.25. Since 192.168.178.6 is itself a file server, we can consider 192.168.178.25 as the only other host.
By filtering 192.168.178.25, we can investigate all communication patterns connected to this IP. If there is only one flow to 192.168.178.22, we can consider 192.168.178.25 as the index patient.
IV. ARP Spoofing
In the following example, the network IDS report of the customer data center reports an ARP spoofing attack. The IDS tells us that IP address 192.168.178.21 is affected by this attack. We need to obtain the attacker's MAC address to search for the switch and corresponding port where the attacker is located in the network.
The IP network of the customer data center is statically addressed, so we can only see a one-to-one mapping between IP and MAC addresses. We enter the Local Assets Dashboard to investigate this IDS alert using IOTA.
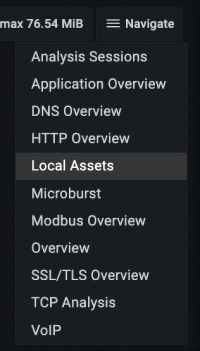
Figure 5: Navigate to the Local Assets Dashboard
Then, we can filter the source IP address by executing the filter rule 'IP_SRC = 192.168.178.21'. We can see two MAC addresses under the 'Client List List'. The MAC address 14:1A:97:9E:AC:D5 is the original MAC address. Therefore, the attacker's MAC address is 60:3E:5F:36:2B:5B, as shown in the figure below.
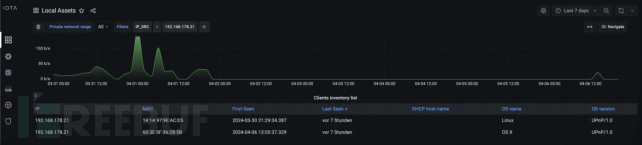
Figure 6: We can see two MAC addresses related to IP address 192.168.178.21. Therefore, we have two MAC addresses
Now, we have all the information needed to search the network for the attacker's location on the switch.
V. TLS Downgrade
Another example is that when we connect to the IDS system of TAP, it generates TLS downgrade attack alert information. The affected company's policy only allows TLS versions 1.2 and 1.3, so we need to investigate which hosts are using TLS version 1.0 or 1.1. To do this, we navigate to the SSL/TLS Overview Dashboard.
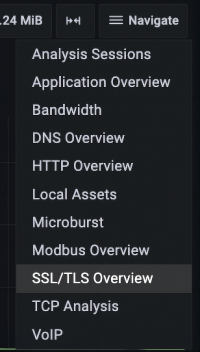
Figure 7: Navigate to the SSL/TLS Overview Control Panel
On the SSL/TLS Overview Dashboard, we can see insecure configurations using TLS 1.1 or 1.0, as well as the SSL/TLS server configuration panel.
As shown in the figure below, we can filter using 'TLS_SERVER_VERSION < TLSv1.2' to obtain only insecure connections. Here, we have a server with the IP address 192.168.178.6, which has TLSv1 and TLSv1.1 activated, and 160 traffic affected by insecure transmission encryption methods. We now know that only this server is susceptible to this type of attack.
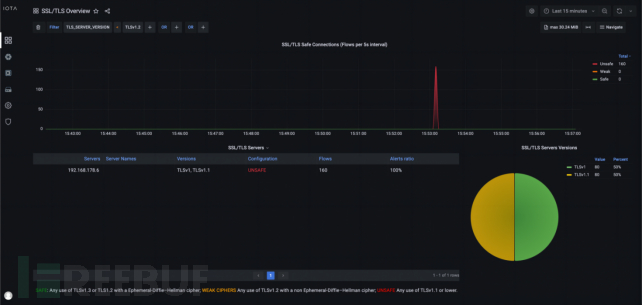
Figure 8: Overview Dashboard for SSL/TLS with an Insecure TLS Version Filter
After that, we need to investigate whether the server has also enabled the secure version. On the SSL/TLS Overview control panel, we created a filter 'IP_DST=192.168.178.6', so that we can filter according to the affected target IP address. We can see that the server has also enabled TLSv1.2 and TLSv1.3 secure versions. Therefore, we can consider that the server has been affected by a TLS downgrade attack.
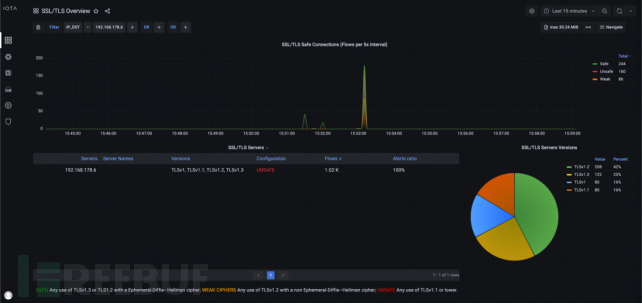
Figure 9: SSL/TLS Overview Dashboard, showing all TLS versions provided by IP address 192.168.178.6
6. Port Scanning
Our next security event is generated by Terminal Protection. IOTA can identify port scanning and clear the host that generates the scan. Therefore, we need to navigate to the TCP Analysis Dashboard.
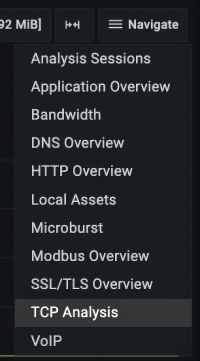
Figure 10: Navigate to the TCP Analysis Dashboard
On the 'TCP Analysis' panel, we can filter 'Incomplete 3-way or No Data (Incomplete 3-way w/o Data)'. This helps us to check the so-called TCP half-open as an incomplete three-way.
TCP half-open helps identify attackers who send SYN, wait for SYN/ACK, and keep the handshake open. Attackers can obtain information about open ports without completing the TCP handshake through ACK. In some cases, handshake data is displayed without data transmission, indicating port scanning.
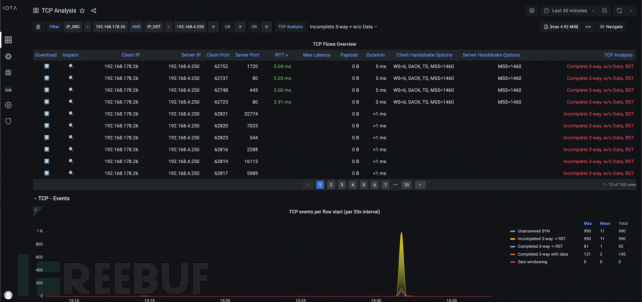
Figure 11: TCP analysis dashboard with source IP address and destination IP address filters, as well as our metrics 'Incomplete 3-way' and 'No Data'
7. Export data for record-keeping purposes
Sometimes, it is necessary to export captured data for thorough forensic analysis or further investigation. This process can be executed on demand or proactively to ensure that we are not limited by the storage capacity of IOTA.
We can navigate to the 'IOTA Database' option in the left menu for this operation. Subsequently, we can go to 'Capture Export', select the preferred protocol, that is, WebDAV or FTP. Click 'Apply' to start the export process, and configure credentials and error handling. According to the protocol, the captured data will be uploaded to the specified server in the form of PCAP files, every thirty seconds.
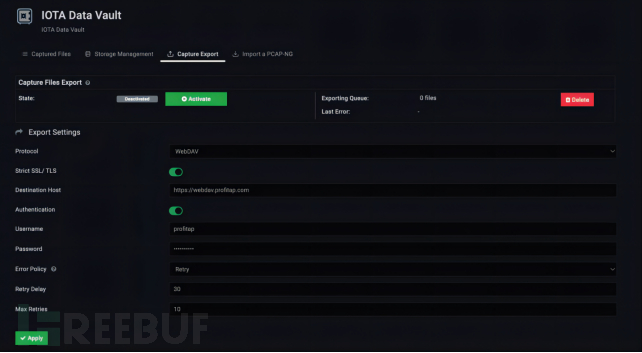
Figure 12: Regular export to WebDAV server
All captured data on the IOTA solid-state drive can be accessed as PCAPNG files in the 'Capture Files' section of the IOTA Data Vault. IOTA generates a new PCAPNG file every thirty seconds. We can select the required data by starting time and then click to download. After downloading the capture files, we can analyze the payload in Wireshark as needed.
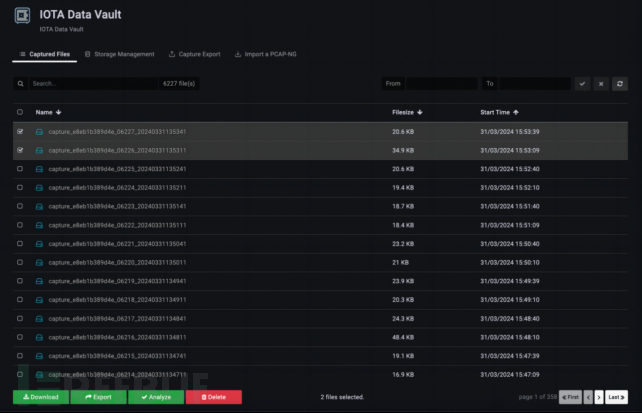
Figure 13: Select and download the PCAPNG file for further study in Wireshark.
Conclusion
IOTA allows flexible network integration and capture options to respond to security alerts. Capture can be performed on demand after reporting an alert, or as a permanent rolling capture.
It is recommended to use permanent capture mode to provide the required data for analysis immediately after an alert is issued.
Traffic can be simply exported as PCAPNG and then imported for analysis as needed. IOTA enables us to quickly and effectively analyze malicious communication patterns using the provided dashboard. Flexible filter combinations and in-depth analysis options can accelerate root cause analysis.

评论已关闭