Preface
Following the previous article “Linux emergency response ideas and skills (Part Two): File AnalysisAfter understanding how to start with files for host-side emergency troubleshooting, this article will introduce the network analysis part of host-side emergency troubleshooting of Linux hosts. By analyzing system network monitoring, network connections, and even traffic, it can help locate the entry point and methods of intrusion, discover the vertical connections between malicious software and C2, the horizontal connections between the victim server and the next target server, establish the entire infection chain of the attack event, and have a comprehensive understanding of the security incidents from a more comprehensive perspective, and also provide a basis for cutting off the attack and isolating the infected system.
The following figure is the Linux host emergency troubleshooting mind map. This article introduces the network aspect from this perspective.
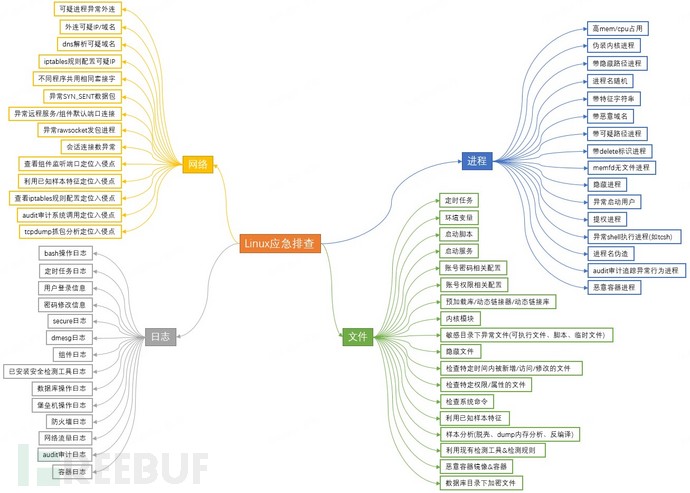
Figure 1 Linux emergency troubleshooting mind map
Firstly, troubleshooting tools
Commonly used network analysis troubleshooting tools include lsof, ss, netstat, iptables, tcpdump, etc. Audit rules can also be added to audit system calls related to network connections, such as connect, socket, etc. Note the distinction in tool usage between rootkit and non-rootkit situations, and in the case of rootkit, the command set provided by busybox can be used.
Secondly, locate suspicious network connections
1. Locate vertical connections (malware and malicious IP)
1) Abnormal external connection of suspicious process
Using the suspicious process located, you can use lsof -n -p [pid] to view the opened files of the suspicious process and check the socket connection information. If a connection to a suspicious IP/domain (such as overseas IP, IP/domain hit by threat intelligence malicious IP/domain, IP not required for business and operation, or onion network domain) is found, it can further confirm that the trojan virus or remote control software is connecting to a black IP or C2.
![]()
Figure 2 Example of abnormal external connection of suspicious process
Common troubleshooting commands:
[root@localhost ~]#lsof -n -p [pid] #View the opened files of the specified process
2) Suspected external IP/domain
Use tools such as netstat or ss, or directly view /proc/[pid]/net/[tcp*|udp*] to investigate network connection status, focusing on established network connections (i.e., those with the status ESTABLISHED or st as 01). If a connection to a suspicious IP/domain (such as overseas IP, IP/domain hit by threat intelligence malicious IP/domain, IP not required for business and operation, or onion network domain) is found, it can further confirm the existence of external connections to black IP or C2, and the process corresponding to the malicious network connection is a trojan virus or remote control software.
If the attacker has used certain concealment techniques to make the network connection invisible, tcpdump can be used to monitor network connections, or audit can be used to monitor the connect system call, and then extract the external ip/domain for further analysis.
![]()
Figure 3 Example of Suspected External Connection
Common troubleshooting commands:
[root@localhost ~]#netstat –neatup | egrep "ESTAB|udp" | grep -v "UNCONN" #netstat view TCP+UDP network connections
[root@localhost ~]#ss -neatup | egrep "ESTAB|udp" | grep -v "UNCONN" #ss view TCP+UDP network connections
[root@localhost ~]#cat /proc/[pid]/net/[tcp*] | awk '{if($4=="01")print$0}' #View TCP connections of a specified process
[root@localhost ~]#cat /proc/[pid]/net/[udp*] | awk '{if($4!="07")print$0}' #View UDP connections of a specified process
[root@localhost ~]#tcpdump -i [network_interface, such as eth0] 'tcp[tcpflags] & (tcp-syn) != 0 and tcp[tcpflags] & (tcp-ack) == 0' -n -v #tcpdump monitoring network connections
[root@localhost ~]#auditctl -a always,exit -F arch=b64 -S connect -k network_connect #Audit monitoring of connect system call, saddr records the target IP and port
3) DNS resolution of suspicious domain names
You can view the DNS server log (default /var/log/messages), or use tcpdump to monitor DNS traffic, or use audit to monitor the libnss and libresolv libraries or the sendto and recvfrom system calls to obtain the DNS domain names resolved by the server. If there is a suspicious domain name resolution behavior (such as hitting malicious domain names in threat intelligence, domain names not needed for business and operations, or onion network domain names), the server may have been compromised, especially through audit, which can associate DNS resolution with specific processes, and further confirm whether it has been compromised by analyzing the associated processes.
![]()
Figure 4 Example of Parsing Suspected Domain Name
Common troubleshooting commands:
[root@localhost ~]#cat [dns_log_path, default /var/log/messages] | grep dnsmasq #View the DNS server log
[root@localhost ~]#tcpdump -i [network_interface, such as eth0] -n port domain #tcpdump monitoring dns traffic
[root@localhost ~]#auditctl -w /lib64/libresolv-2.17.so -p rx -k dns_query; auditctl -w /lib64/libnss_files-2.17.so -p rx -k dns_query; auditctl -w /lib64/libnss_dns-2.17.so -p rx -k dns_query #Audit monitoring libnss and libresolv libraries
[root@localhost ~]#auditctl -a always,exit -F arch=b64 -S sendto -S recvfrom -k dns_query #Audit monitoring sendto and recvfrom system calls
4) Suspicious IP configuration in iptables rules
Check the iptables configuration rules and observe if there are any ACCEPT policies that include suspicious IPs (such as malicious IPs hit by threat intelligence, or IPs that do not need to be configured for business or operation and maintenance). If there are any suspicious IPs, the server may have been compromised, and the attacker may have modified the iptables firewall rules to allow black IPs or C2. However, in most cases, attackers will directly clear the iptables rules.
Common troubleshooting commands:
[root@localhost ~]#service iptables status #View iptables rules
[root@localhost ~]#iptables -t [table, such as filter] -nvL #View iptables rules
5) Different programs share the same socket
lsof/ss/netstat checks if there are any cases where different programs share the same socket (i.e., the same bound IP:port, protocol, and remote IP:port). After excluding some normal business or operation and maintenance programs, debugging tools, and proxy software, if there is such a case, the process may be malicious software attempting to hijack the socket of a legitimate program to achieve the purpose of stealing data or injecting malicious data. At the same time, the process itself, or the守护进程 of the process, or the process that interacts with the process, is likely to have connections to black IP addresses or C2, performing data exfiltration or receiving C2 commands.
2. Locating lateral scanning (infiltrated server and next target server)
1) Abnormal SYN_SENT packets
Check if there are any abnormal SYN_SENT packets on the server using lsof/ss/netstat, for example, if a large number of network connections in SYN_SENT state to the same subnet, different IP addresses, and different ports are found within a certain time frame. If there are a large number of network connection information (especially related to handshake packets) and a large number of IP addresses in the same subnet, or targeted at some ports, it is likely that malicious scanning tools or DoS tools are trying to perform lateral movement or lateral attack.
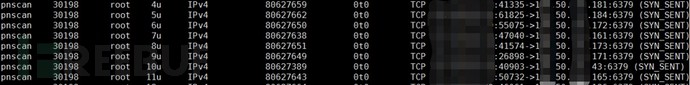
Figure 5 Example of abnormal SYN_SENT packet
Common troubleshooting commands:
[root@localhost ~]#lsof -i -n | grep "SYN_SENT" # lsof view SYN_SENT state socket
[root@localhost ~]#ss -naetp state syn-sent # View network connections in SYN_SENT state
[root@localhost ~]#netstat -naetp | grep "SYN_SENT" # View network connections in SYN_SENT state
2) Abnormal remote service/component default port connection
Check if there are any abnormal remote services or component default port connections on the server using lsof/ss/netstat, for example, if a large number of remote services (SSH, VNC, RDP, etc.) or vulnerable components (redis, mysql, postgresql, etc.) are found within a certain time frame, it is likely that malicious scanning tools are trying to brute force or exploit vulnerabilities for lateral movement.
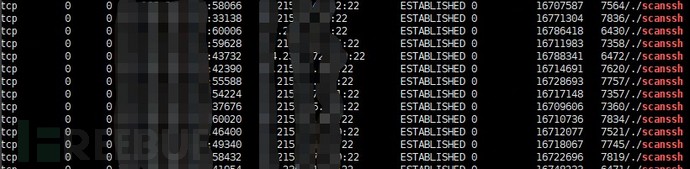
Figure 6 Example of abnormal SSH remote service connection
Common troubleshooting commands:
[root@localhost ~]#lsof -i -n | grep ESTABLISHED | egrep "\->.*:[port, such as 22]" # lsof view socket of specified remote service port
[root@localhost ~]#ss -naetp state established | awk '{if($4~/:[port, such as 22]$)print$0}' # View network connections to a specified remote service port
[root@localhost ~]#netstat -naetp | grep ESTABLISHED | awk '{if($5~/:[port, such as 22]$)print$0}' # View network connections to a specified remote service port
3) Abnormal rawsocket packet sending process
View the server for abnormal rawsocket packet sending processes using lsof/ss/netstat, for example, if there are suspicious processes that send tcp/udp protocol rawsocket packets, such as rpm verification failure, non-business or operation and maintenance needs, etc., it may be an attempt by DoS tools to perform lateral attacks, or it may be a scanning tool or malware backdoor program.
![]()
Figure 7 Example of abnormal rawsocket packet sending process
Common troubleshooting commands:
[root@localhost ~]#lsof -n | grep raw #lsof view raw socket
[root@localhost ~]#ss -naewp #View rawsocket network connections
[root@localhost ~]# netstat -naewp #View rawsocket network connections
4) Abnormal session connection count
Observe all ESTABLISHED state network connections on the server, while excluding connections generated by local loopback addresses, business, and operation and maintenance components, if session connection numbers are abnormal (such as too many connections from IP addresses within a unit of time), it is considered that the server may be performing malicious lateral scanning.
3. Tracing
1. View the listening ports of components
Use ss/netstat to view the status of open listening ports of processes, pay attention to suspicious open listening ports (such as non-business or operation and maintenance needs, very common ports), and pay attention to the status of open listening ports of remote services and components that are frequently exposed to vulnerabilities (such as ssh, java, redis, docker, especially listening ports for service default ports). Generally speaking, the attack surface of the components that are open to the system is large, combined with the complexity of the configuration password, the historical vulnerabilities and versions of the components, especially checking whether the system's open components exist rce, unauthorized access, deserialization, weak password and other obvious security issues, and then through the search for log intrusion traces or vulnerability reproduction, further verification is carried out.
For example, during an emergency investigation of a mining virus event on a server, the server administrator enabled the redis service, used the default port 6379, and set a weak password, so the attacker was located by guessing the weak redis password. For example, during an emergency investigation of a mining virus event in a cluster, the server administrator wanted to deploy a single-machine tikv docker cluster, used an open-source docker configuration file to start, did not notice that the container started the spark service, and the spark master api used the default configuration (using the default port 7077 without access control), so the attacker exploited the unauthorized access vulnerability of the spark master api to入侵, submitted malicious programs to the master node, and infected worker nodes at the same time.
Common troubleshooting commands:
[root@localhost ~]#ss –neltup | more #Check the status of open listening ports
[root@localhost ~]# netstat -neltup | more #View the status of open listening ports
2. Utilize known sample features
Search for whether the suspicious IP/domain/URL in the connection information matches the IOC features of any virus family. You can search the internet for the analysis report of the virus family, and according to the historical intrusion methods mentioned in the report (such as brute force, vulnerability exploitation, credential theft, etc.), combine them with the current server configuration, started components, etc., to locate the entry point of the intrusion.
3. View iptables rule configuration
On the one hand, check if there is any component that has opened a port without access control among the existing iptables rules, and focus on investigating the historical vulnerabilities and insecure configurations of the component, to verify whether it is blackened due to the above reasons. However, hackers may clean up iptables after an intrusion, so it may be necessary to confirm the configuration of iptables rules before they were cleaned up with operations and maintenance personnel.
On the other hand, after hackers infiltrate, to avoid other competing products from infiltrating the server again, they may modify iptables, making the ports of vulnerable components no longer accessible from the outside. Therefore, we can combine the open ports of the component and the suspicious port restriction rules of iptables to further confirm the entry point of the intrusion.
![]()
Figure 8 Example of malicious sample modifying iptables rules
4. Utilize audit audit
Add audit rule auditctl -a always,exit -F arch=b64 -S connect [-F success=1 -F path=xxx] -k xxx, monitor the connect() system call, and check the logs to determine if a suspicious program initiated a suspicious connection. Pay attention to records of connections to suspicious IP addresses and ports, and records of large-scale outgoing or incoming connection requests from the same program that are not for business or operations. If such a suspicious program is locked, you can set -F path=xxx to focus on auditing the network connections of the process, or further add audit rules auditctl -w xxx -p rx -k xxx to trace the associated processes, thereby confirming the daemon process or parent process, extracting the complete sample, and making it easier to confirm the entry point of the intrusion. Audit still has an effect when most hidden techniques are used in the sample (hidden processes, hidden ports, hidden files, etc., non-evading auditd techniques).

Figure 9 Example of audit trace of kdumpd network connection log
Common troubleshooting commands:
[root@localhost ~]# auditctl -a always,exit -F arch=b64 -S connect [-F success=1 -F path=suspicious program path] -k network_connect #Audit monitoring of the connect system call, can specify the suspicious program path and call result
[root@localhost ~]# auditctl -w suspicious program path -p rx -k sus_pro #audit audit monitoring the opening and execution of suspicious program paths for tracking associated suspicious processes
5. tcpdump packet capture analysis
If the above tracing methods cannot locate the intrusion point, you can try to capture the entry traffic with tcpdump, because automated attacks may trigger multiple times. If malicious traffic can be captured again, it may be possible to analyze specific intrusion methods. For targeted attack scenarios that often trigger only once, the possibility of packet tracing is small. You can use tcpdump to capture and observe suspicious connections. When setting capture rules, you can communicate with administrators to understand the normal business or operation and maintenance required network connection situations to assist in confirming the packet filtering rules.
For the captured packets, further network traffic analysis can be performed, with multi-level checks on packet fields and content to identify potential malicious behavior, locate specific intrusion methods, and identify exploited vulnerabilities, such as checking protocols (such as ICMP may be used for network probing and DoS attacks), packet size, User-Agent header (such as identifying common automation tools, crawlers, or malicious clients伪装成legitimate users), other HTTP header fields (such as checking Referer, Cookie, Content-Type, identifying abnormal or suspicious values), and content feature matching of packet payloads, identifying abnormal encoding or compression methods. At the same time, many open-source tools and projects provide rich sets of network traffic analysis rules that can be utilized to effectively improve the efficiency and accuracy of network traffic analysis, such as Suricata, Snort, and Zeek.
Common troubleshooting commands:
[root@localhost ~]# tcpdump -i [network_interface, such as eth0] -n [src host source IP|src port source port|dst host destination IP|dst port destination port|proto protocol] -w record.pcap #tcpdump captures packets to the specified file, filtering information such as source IP & port, destination IP & port, and protocol
Summary
By analyzing the system network monitoring, network connections (vertical and horizontal), and even network traffic, combined with the malicious process startup, malicious file disk drop, and log record intrusion traces on the associated servers, we can construct the infection chain of the attack event. The global topology of the infected servers includes the first batch of compromised servers and initial intrusion entry points, all servers infected by lateral movement and horizontal intrusion entry points, the levels of lateral movement and the order of servers being infected, the connection between remote control software on the infiltrated servers and C2, and the connection between trojan backdoor programs and black IPs.
With such a global perspective of a security event, it also provides a basis for security personnel to follow up on system recovery and reinforcement work, such as closing unnecessary open service ports, using non-default ports for open services, detecting network connection IOC features and issuing alerts or cutting off, configuring access control for firewalls and components, configuring complex passwords for components and configuring authentication.
The following summarizes some investigation commands in the process of Linux emergency network analysis.
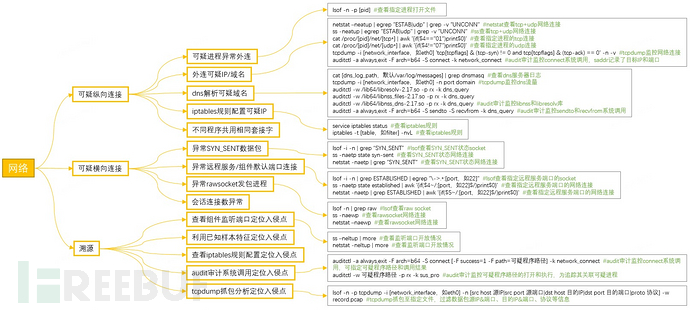
Figure 10: Mind map of network analysis for Linux emergency investigation
In the next article, we will introduce the log analysis part of Linux emergency investigation.
The log files of systems and components record a large amount of historical operation information, which can help track the attacker's activity path and behavior patterns. In the case that the attacker has not cleaned up the logs, it may be possible to find clear intrusion traces, which can help sort out the timeline of attack activities, and the operation features recorded may also reveal security vulnerabilities existing in the system or components. In the case where there are no clear intrusion traces recorded in the logs, or the malicious program uses certain hiding techniques, it may be necessary to formulate new log recording rules for suspicious processes, files, etc., or to enable more detailed level of log recording for further investigation. I believe that in the next article, through the introduction of log analysis, we will have a global understanding of the entire attack activity and timeline.
Previous review
Linux emergency response thinking and skills (Part 2): File analysis
Linux emergency response thinking and skills (Part 1): Process analysis

评论已关闭