ELK
ELK refers to the integration of three tools, including elasticsearch(E), logstash(L), and kibana(K). Sometimes it is also called EF(K), because when the volume of logs is not large, it can simply use filebeat to forward logs to ES.
To describe the functions of the three tools in plain language is
elasticsearch: stores and queries logs
logstash: forwards and processes logs
kibana: displays log data charts

Overall architecture:
jxwaf(TCP transmission)->logstash(listens for TCP, accepts logs, processes logs, and forwards logs)->elasticsearch(receives logs, stores logs)->kibana(dispplays logs).
In order to give you a better experience, I have prepared a set of docker-compose that integrates all tools, one-click to start the service, address:Here
The logstash.conf configuration is as follows
input {
    tcp {
        port => 5000
        codec => json
    {}
{}

  filter {
      translate {
        field => "[protection_type]"
        destination => "[attack_type]"
        dictionary => {
          "jxwaf-sql_check" => "SQL injection attack"
          "jxwaf-xss_check" => "XSS attack"
          "jxwaf-directory_traversal_check" => "Directory traversal attack"
          "jxwaf-command_inject_check" => "Command injection attack"
          "jxwaf-sensitive_file_check" => "Sensitive file scan attack"
        {}
      {}

    geoip {
            source => "client_ip"
    {}

    {}


output {
    stdout {
        codec => rubydebug
    {}
{}


output{
 elasticsearch{
    hosts=>["es01:9200"]
    index => "jxwaf-%{+YYYY.MM.dd}"
   {}

{}
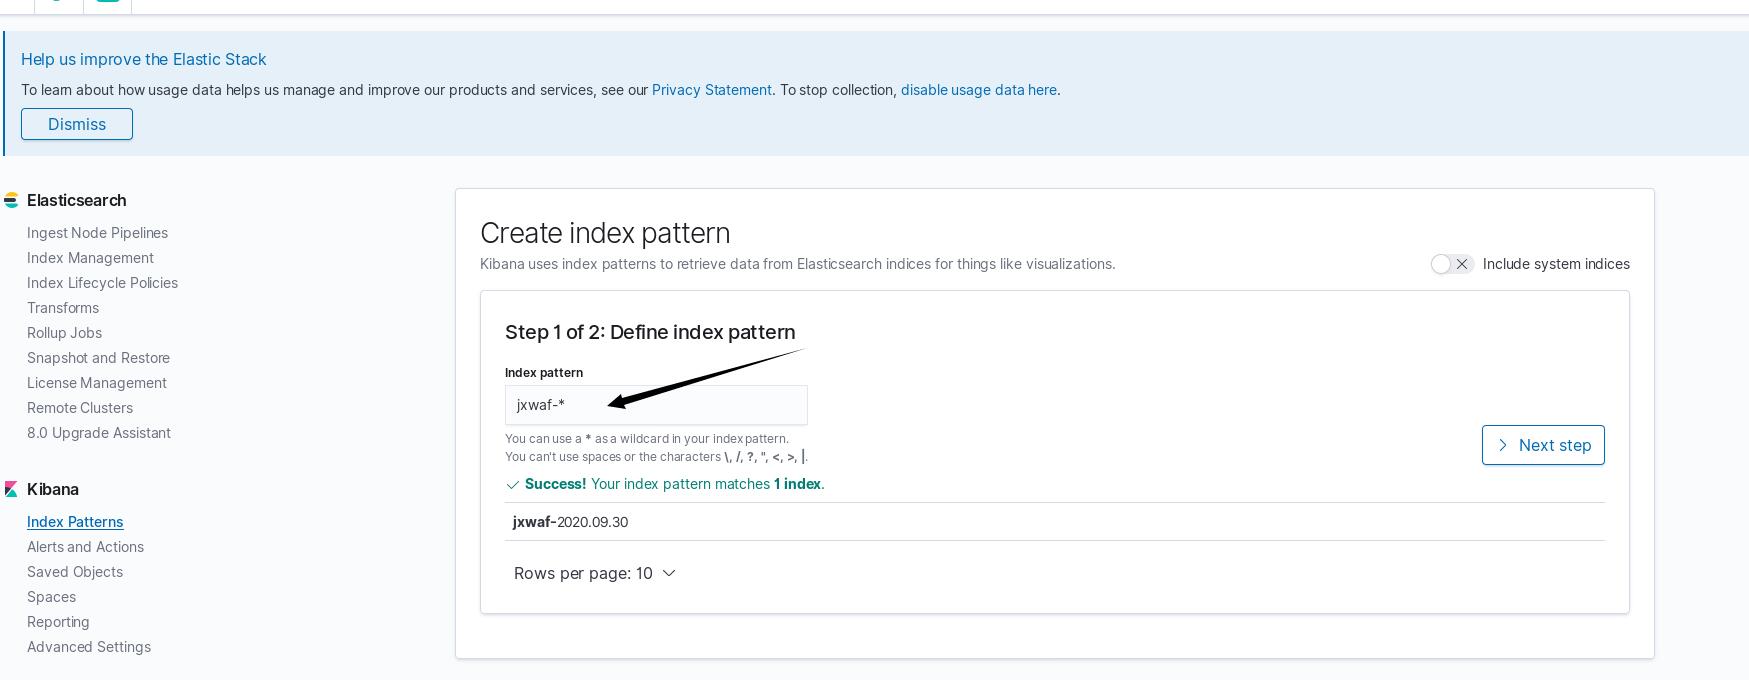
Open the browser to access port 5601. When the jxwaf logs are delivered to ES through logstash, an index name will be generated. Use * to match all jxwaf logs of any time
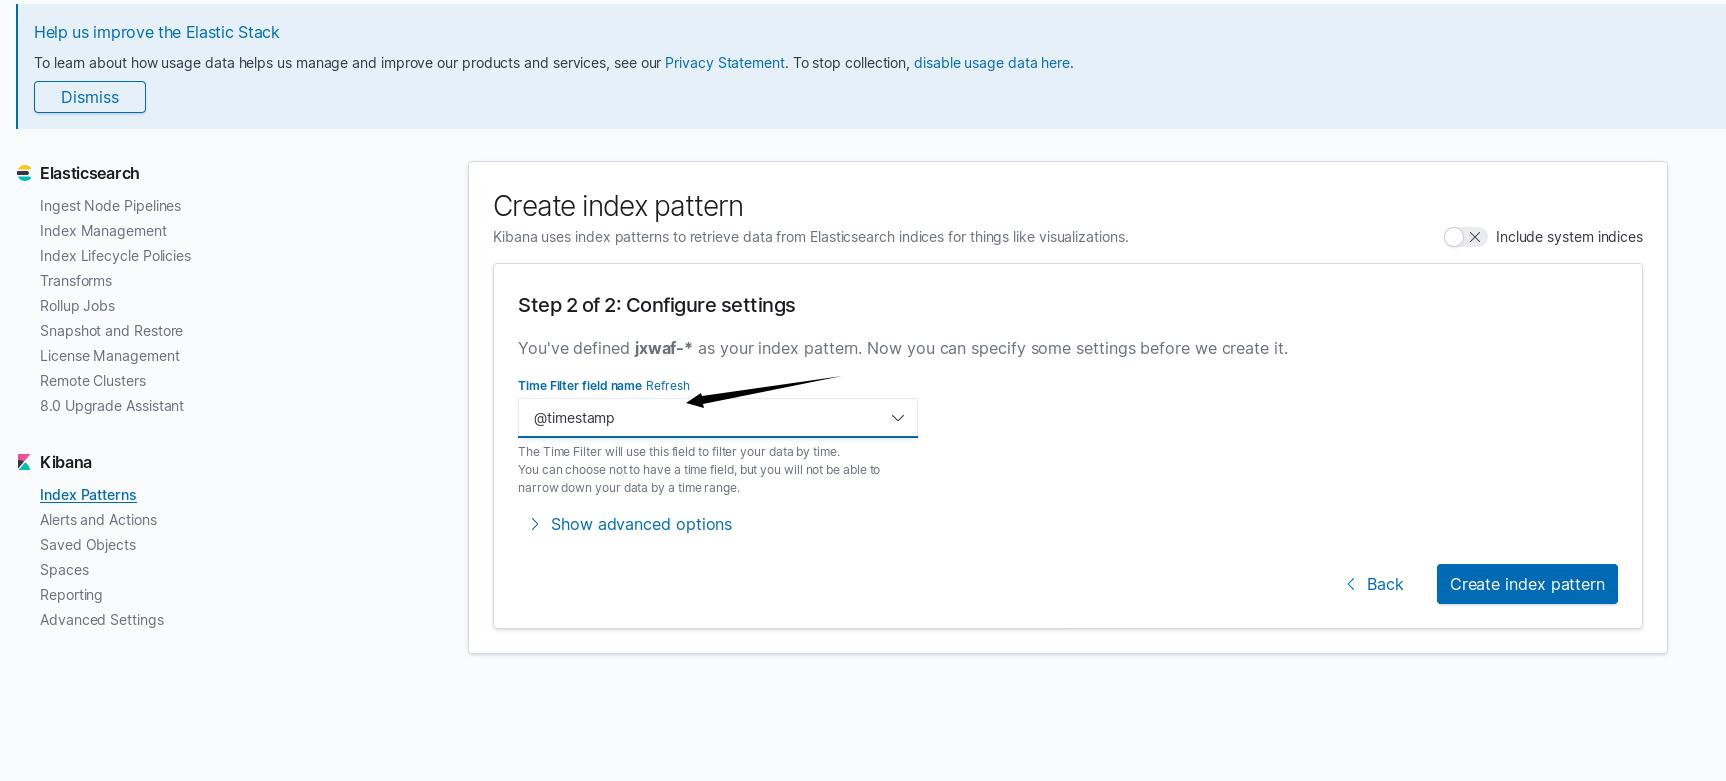
Specify time as the condition for log filtering query
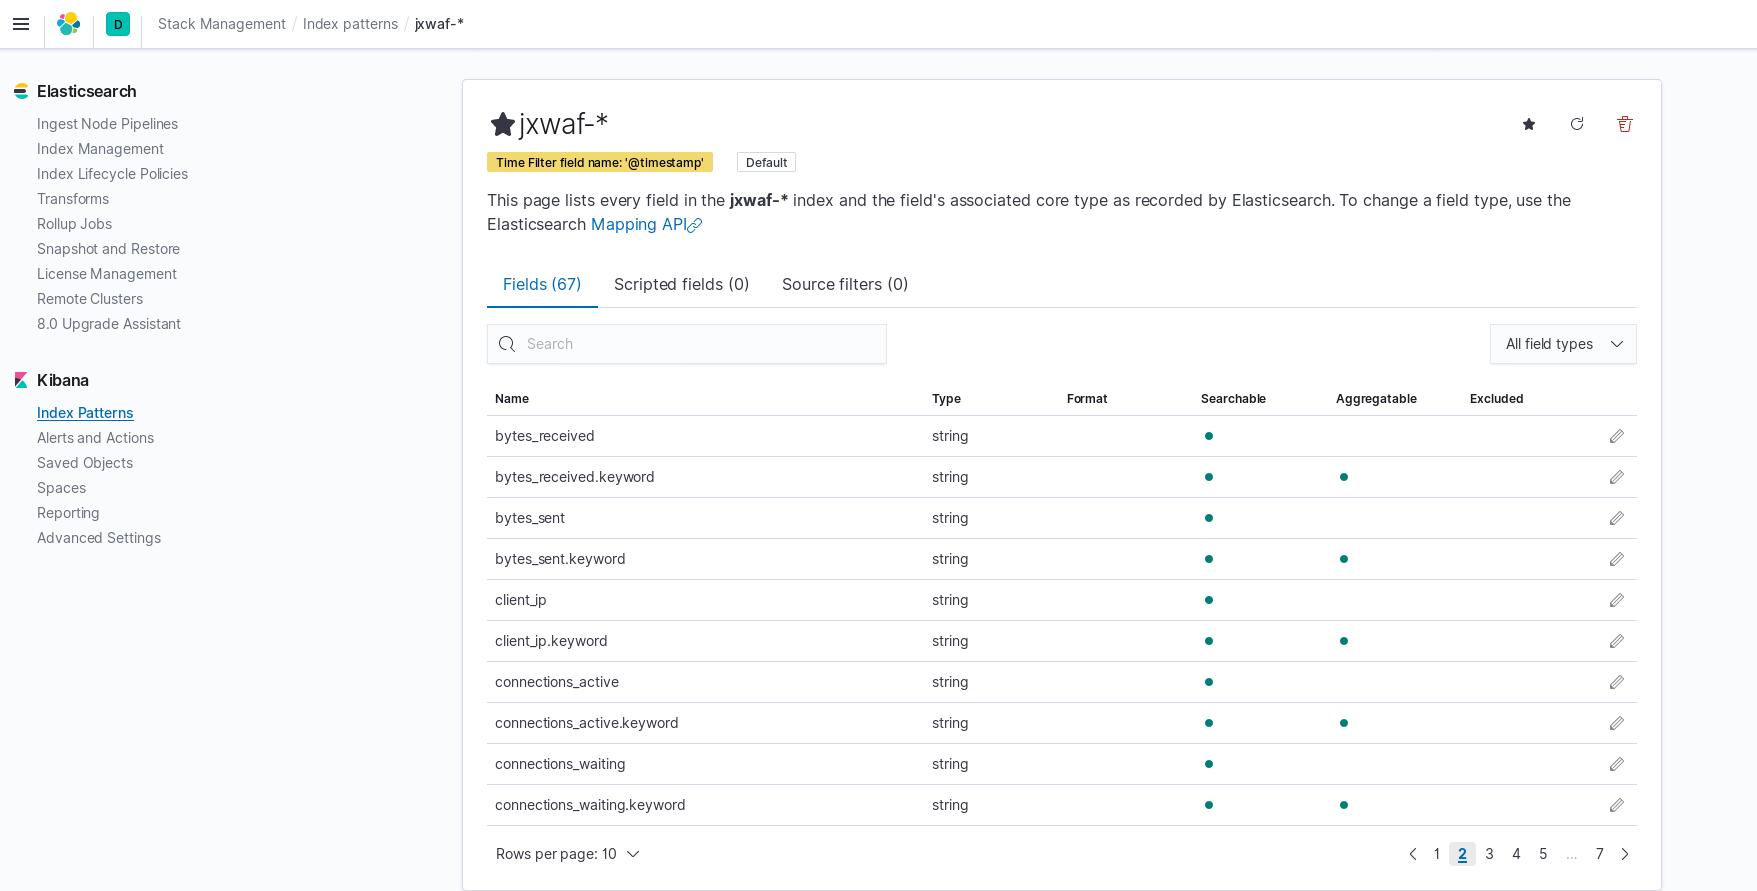
After setting the time filtering conditions, ES will automatically identify the fields of the logs passed, because we are passing in JSON format, so it can be directly parsed to all fields without any additional operations.
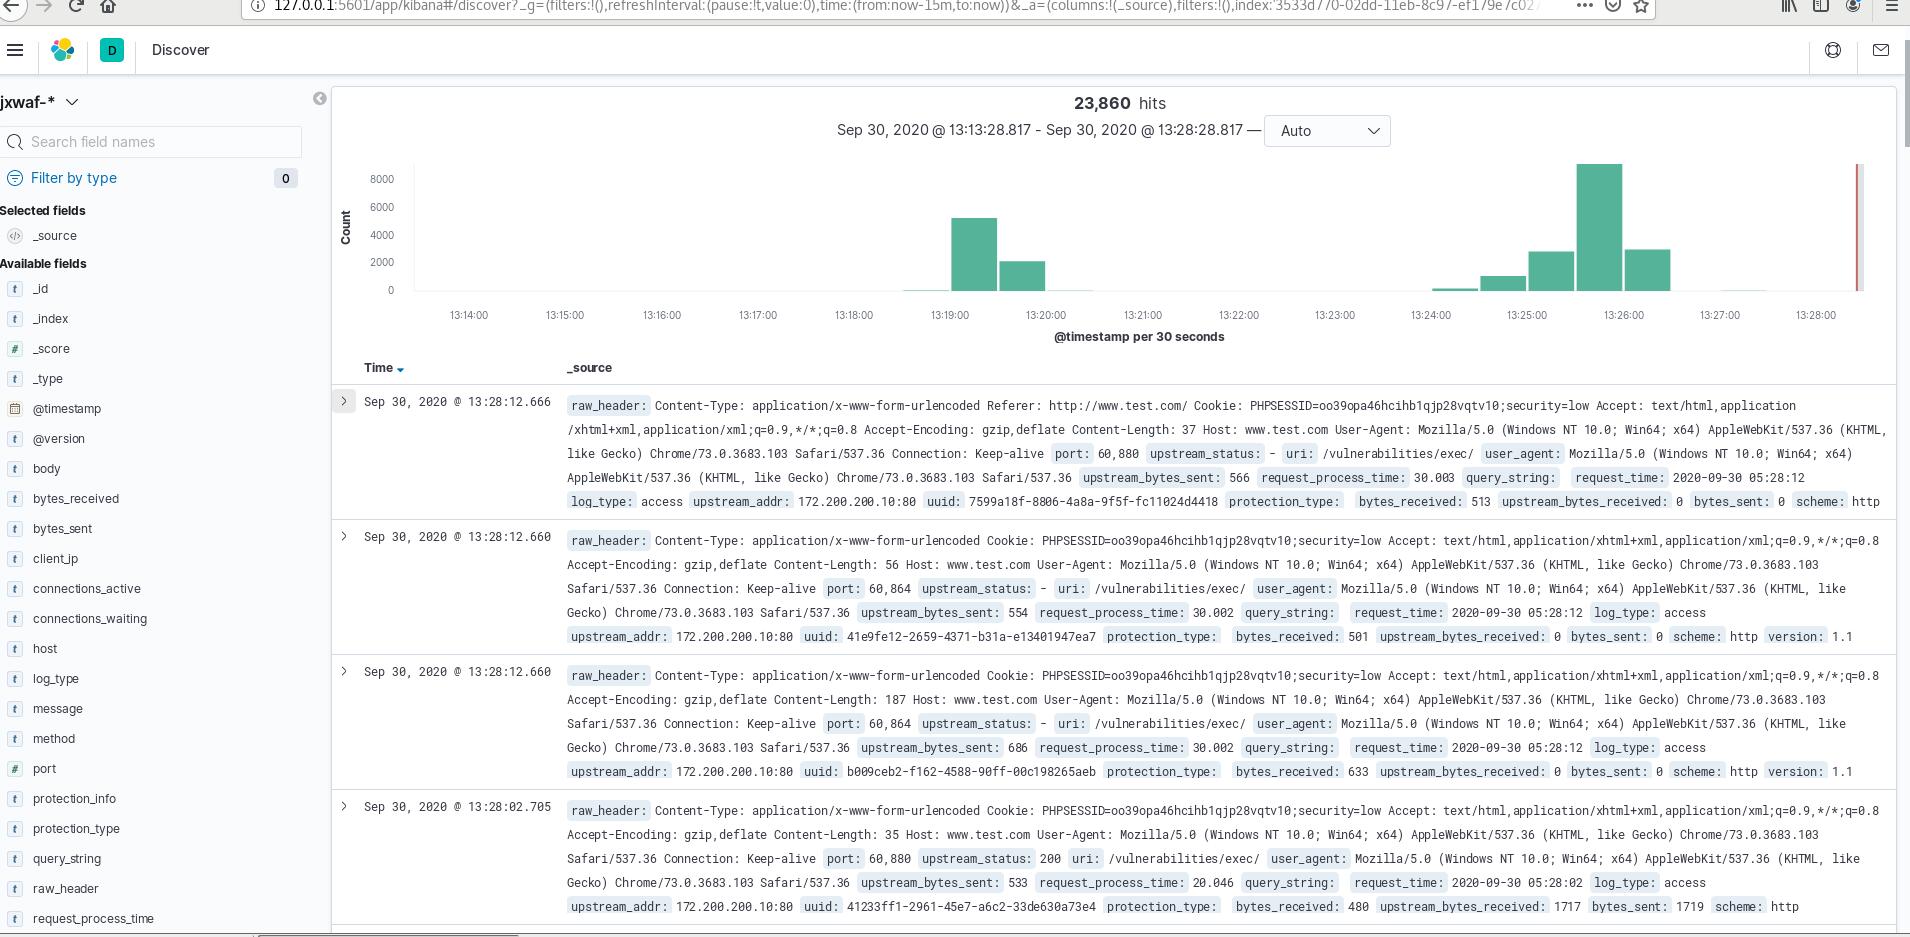
Open discover, and you can see the jxwaf logs.
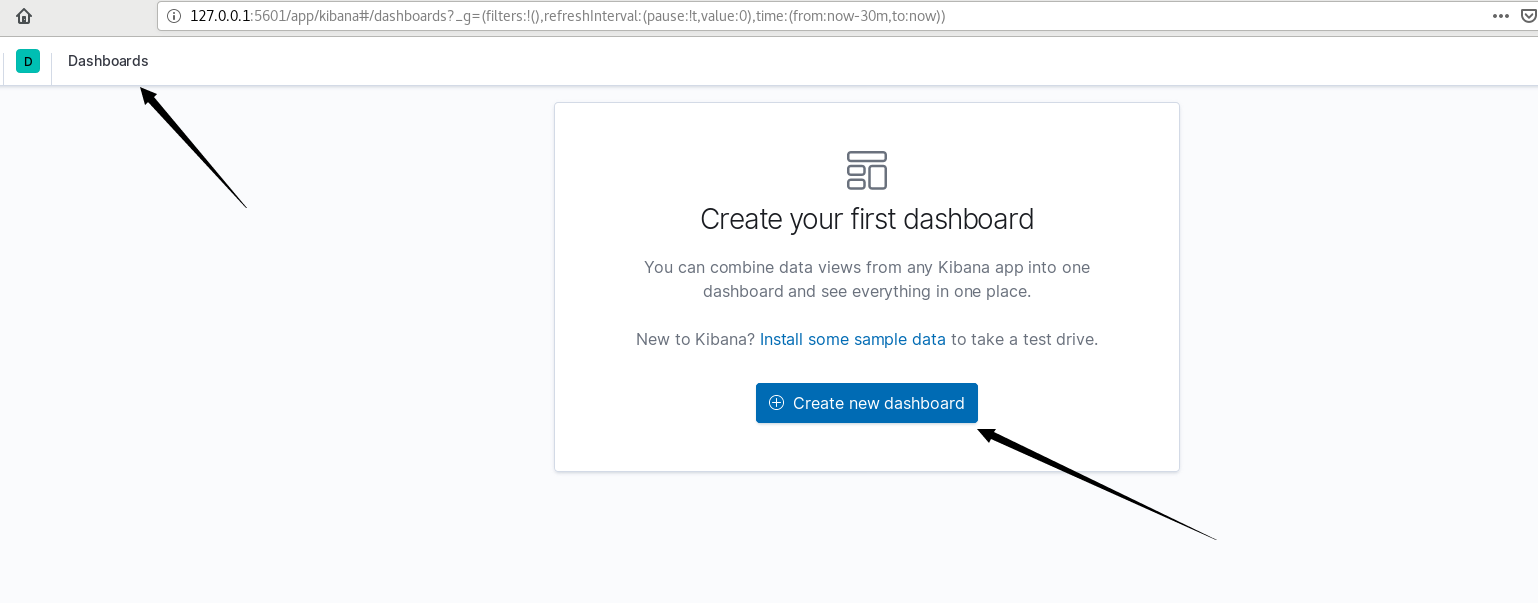
Create a dashboard
After the log storage is completed, analysis and alerting are required, so it is necessary to establish chart display. For chart creation, Kibana can create some basic charts with just a few clicks, without the need to write an ES query statement, so it will still be relatively simple.
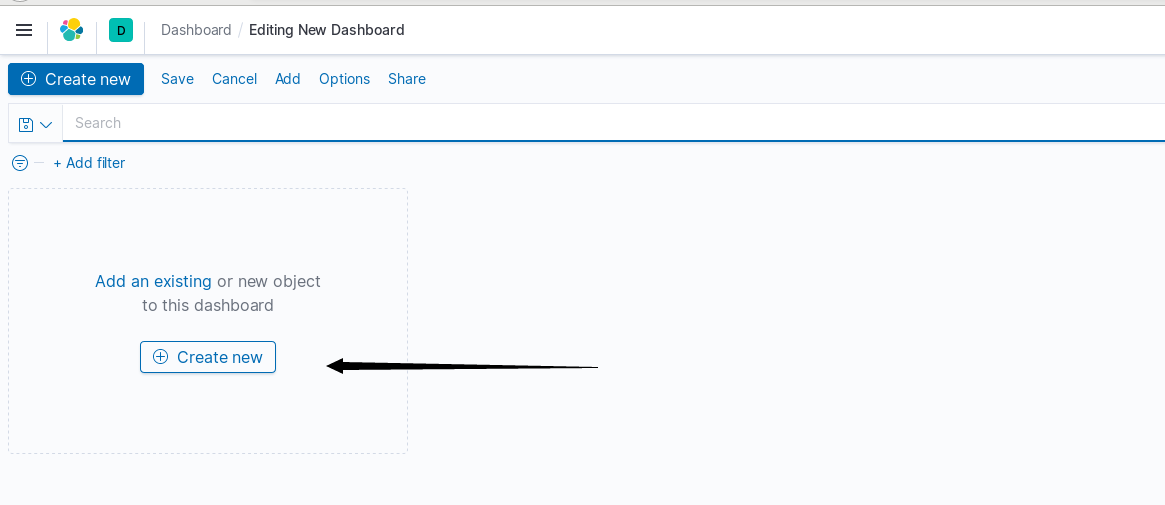
Come to the dashboard and create a new dashboard:
Create a visual chart
The following figure shows the types of visual charts that can be created, generally speaking, line charts, tables, and pie charts are commonly used charts.

评论已关闭