Hi, I am kenant from the Guanyu战队, today I will start sharing a series of articles on malicious file analysis, and the first article will talk about the history and present of decompiling technology.
First, basic concepts
1. The concept of packing
PackingIt is a method of changing the encoding of executable program files or dynamic link library files through a series of mathematical operations (there are still some packing software that can compress and encrypt drivers), in order to achieve the purpose of reducing the file size or encrypting the program encoding.PackingGenerally refers to the method of protecting program resources, and the main purpose is to prevent the program from being illegally tampered with or easily reverse-engineered to obtain the source code.
2. The concept of decompiling
Corresponding to packing isDecompilingDecompilingGenerally refers to a method of removing the protection of the program and restoring the file to the state before it was packed.DecompilingAfter that, you can modify the program resources, which is also convenient for crackers to perform static analysis and reverse engineer the source code of the program.
DecompilingDecompiling methods can also be divided into hard decompiling and dynamic decompiling.
**Hard decompiling:** As the name implies, this decompiling method is biased towards static analysis to obtain the algorithm of the encrypted or compressed process of the packed program, and then write the reverse decompiling algorithm based on this algorithm for decompiling. However, many shells have the characteristics of encryption and deformation, and the program content obtained each time after packing is different, resulting in certain limitations of hard decompiling, and it is not very applicable to shells with high strength.
Dynamic decompiling:Since the packing program must perform decompiling operations during runtime to ensure that the program can correctly obtain resources and run properly, dynamic debugging of the program can be performed to find the realOEP (the entry point of the source program)Then, through dump memory image, and reconstruct and repair the memory image into a standard executable file, thus obtaining an executable program without a shell. Compared with hard decompiling, this method has a wider range of application, and is suitable for decompiling operations on unknown shells and shells with high strength.
Second, introduction of decompiling purposes
Many readers may ask, what is the purpose of decompiling, or where is the significance of decompiling?
Of course, at present, software analysis can dynamically analyze the running logic of a program even without decompiling, and even directly reverse engineer the source code of the program through dynamic analysis. So, where is the significance of decompiling?
Shell processing can encrypt or compress the program's resources, causing static analysis to be unable to directly view program resource information such as (strings, IAT (Import Address Table), etc.) using tools. For those with localization needs, resource information cannot be read directly, and resource editing tools cannot be used to replace or modify resource content. For those who crack or analyze software, deobfuscation can allow for further static analysis of the software, and by combining static and dynamic analysis, key code points can be quickly located for cracking.
3. Introduction to deobfuscation methods
1. Use tool deobfuscation
As everyone knows, there are many shell programs corresponding to the outside world, such asUPX, ASPACK, ASProtectetc., after operating on executable programs with shell programs, the program is processed with a shell.
Correspondingly, there must be deobfuscation programs for shell programs, such as UPX itself can deobfuscate the shells added by UPX,ASPACKandASProtectAlthough it does not have the function of deobfuscation itself, it existsUNASPACKandASProtect-UnpackSuch programs can deobfuscate the shells of corresponding versions.
The general process of using a tool to deobfuscate is as follows: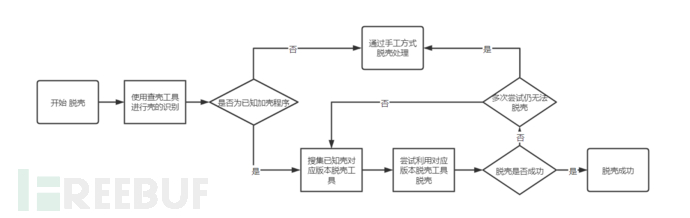
Use the shell detection tool to query the type and version information of the shell.
Find the corresponding version of the deobfuscation tool on the Internet or use the pre-collected deobfuscation tool for deobfuscation processing.
After using the tool to deobfuscate, use the shell detection tool to query again and combine other means to confirm whether deobfuscation is successful.
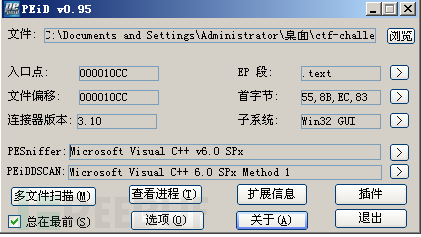
The first step is relatively simple and can be used to identify the shell using common tools such as PEID, ExeinfoPe. The problem may lie in the fact that some shell features may not have been included in the relevant tools, leading to the possibility of not identifying certain shells, and thus unable to proceed with the subsequent steps. Possible solutions include independently collecting the fingerprint features of newer shells and writing the discovered features into the tool's feature library for shell identification.
Whether the work in the second step is effective depends on the accuracy of the first step. If the identification results of the first step are incorrect or no effective information is found, the work in the second step is invalid. There are many ways to collect deobfuscation tools through the Internet, including but not limited to searching for deobfuscation tools through github, search engines, and major security forums. It is worth reminding that the collected deobfuscation tools may be malicious software with backdoors, and readers need to use other means to distinguish them.
The role of the third step is to confirm whether deobfuscation is successful, and there may be several situations that can lead to deobfuscation failure:
The shell detection tool's identification results are incorrect.
The collected deobfuscation program versions are incompatible or there are problems with the deobfuscation program itself.
The shell has certain deformations that cause problems with general deobfuscation programs.
It can be seen that tool deobfuscation has great limitations. If the shell is new or deformed, it may completely fail, and at this point, manual deobfuscation must be considered for processing.
Since the use of unpacking tools is not the main content of this article, it will not be elaborated here.
2. Manual unpacking
The general process of manual unpacking is as follows: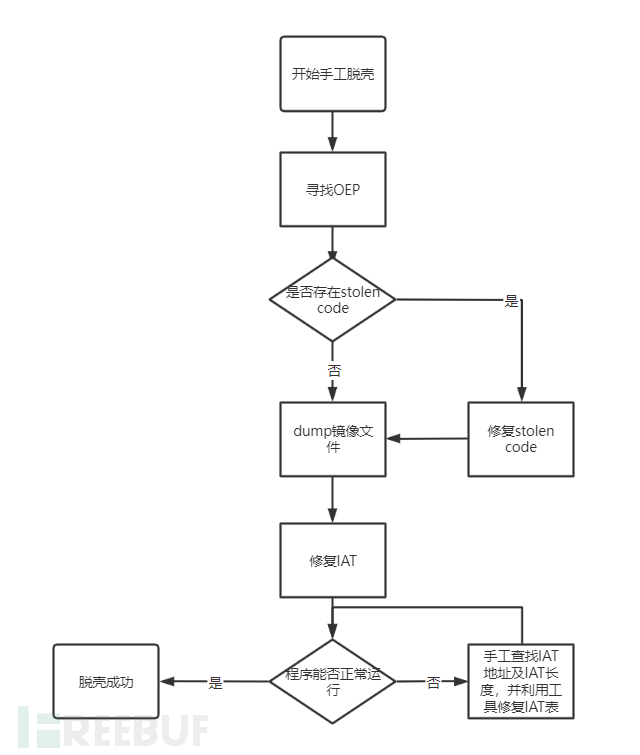
Find the program OEP
Determine whether there is Stolen code, if there is stolen code, then repair it
Dump image file
Repair IAT
Manual unpacking refers to finding the real OEP by manual debugging to perform unpacking. If the shell has the phenomenon of Stolen code, it is necessary to complete the stolen code after finding the real OEP, and then repair the program IAT and other contents. (Note: stolen code can be illustrated by a simple example that the code at the program entry point is executed during the unpacking or decrypting process of the added shell, causing the code at the OEP to be partially missing. See the figure below for details).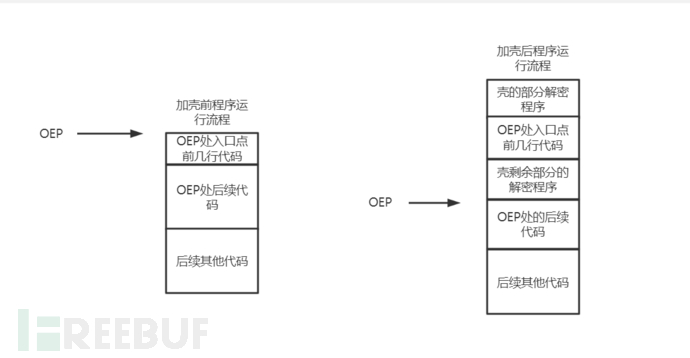
From the above description, we can know that the essence of manual unpacking is to approach the real OEP by some manual debugging means, skip the code content that the shell needs to execute, and approach the real OEP infinitely. At the same time, by understanding the entry signs of common languages, restore the stolen code, and finally repair the encrypted or compressed IAT of the packing program.
Finding the OEP method:
The methods to find the OEP mainly include the following eight methods: here, we list the eight methods first, and each method's detailed content will be introduced in the fourth section of this article with examples.
Single-step debugging method
ESP law method
One-step direct method
Simulation tracking method
SFX method
Memory image method
The last exception method
Using the first API called by the application
Four, unpacking method example analysis
In this section, we use the program to demonstrate the manual unpacking methods mentioned above, and give a simple explanation of the IAT repair involved in the unpacking process.
1. Find the OEP in eight ways
(1) Single-step tracking method
By using debugging tools such as Ollydbg for single-step tracking, follow it until the real OEP, since there are many jumps and function calls during single-step tracking, it will take a lot of time to follow them one by one, so it is necessary to skip the internal process of loops and function calls in some way, such as skipping upward jump instructions, skipping call to far address functions, and following call to near functions, etc.
Taking Aspack V2.12 as an example, you can first use PEID or exepeinfo to query the type of the shell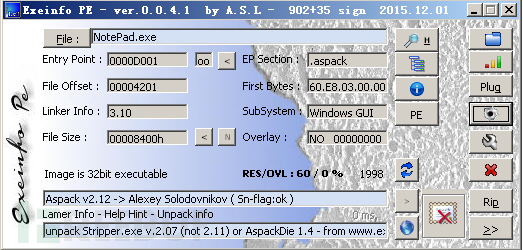
Then use OD to load the corresponding packed file and perform single-step tracking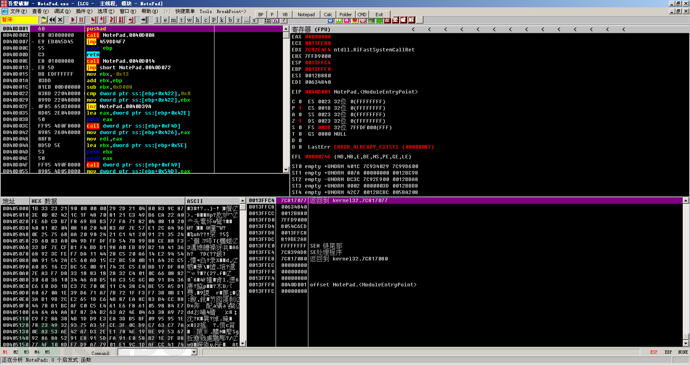
The program first pushes 'ad', then performs a near call, calling 0040D00A, at this time eip is 0040D001, so it is a near call. Here, use F7 to follow up (if you use F8, the program will run directly, which is also known as the program flying directly, and it can also be analyzed that F7 should be followed up to continue the analysis).
Then you can see the OD interface as follows: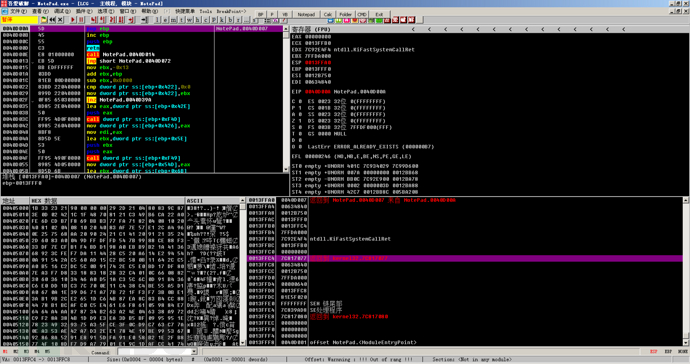
Press F8 to step over retn to jmp and find that it is a downward jump. Follow up with F8, and then it is followed by call0040D014, near call, and follow up with F7.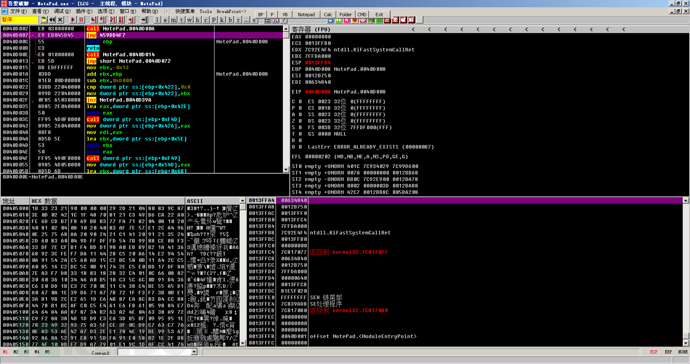
According to the principles mentioned above, keep pressing F8, and when encountering an upward jump, select the next instruction to be executed after the jump and press F4 to execute to the next instruction and continue executing.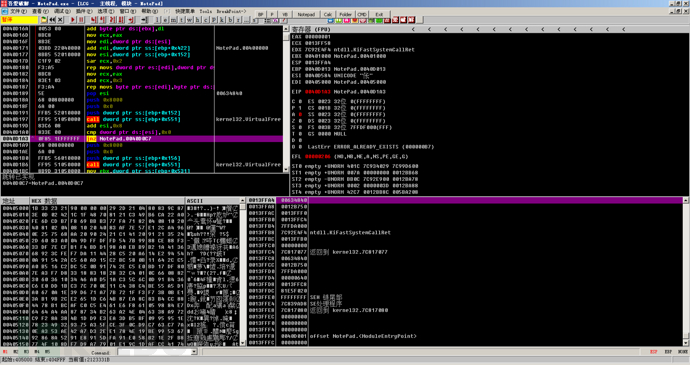
The follow-up was always to 0x004010CC, where the code was as follows. This is because the code before this was decompressed, causing OD to possibly consider the content here as a string or other content, and not accurately identified as an instruction. You can use call+A or delete analysis to restore it.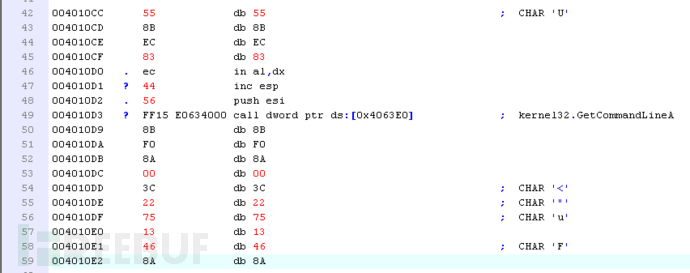
After deleting the analysis, it was found that the code at the entry point is similar to that of VC++, and the OD plugin was tried for unshell. Since it does not involve IAT reconstruction, the program can be run directly after unshell. The query found it to be a VC++6.0 program, and the unshell was successful.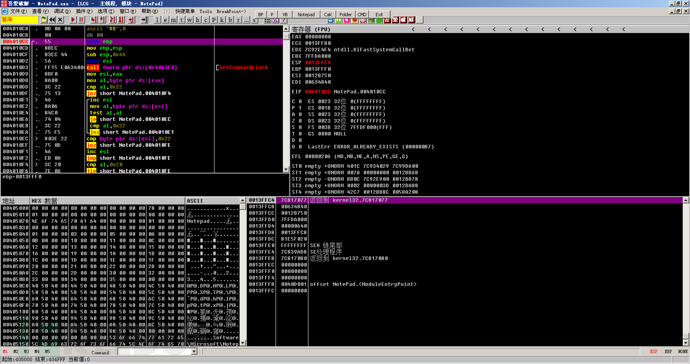
(2) ESP Law Method
Many compressed shells and some encrypted shells will push the current register state onto the stack, such as pushad, pushfd, etc., during the decompression or decryption process of the shell. At this time, ESP will change. After the decompression or decryption program is executed, the previously stacked registers need to be popped out. Since it is almost impossible to perform other operations on this ESP value during the decompression and decryption process, when this ESP address is operated again, it is usually close to the real OEP of the program. Only a few steps of single-step following are needed to achieve unshell.
The same Aspack v2.12 is used for demonstration.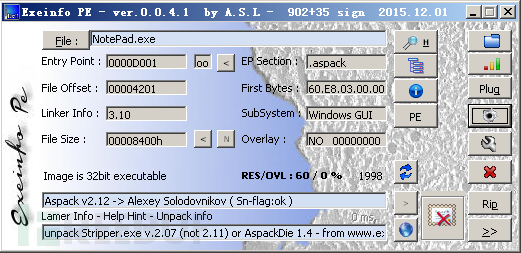
After loading the program, we find that the ESP value is 0013FFC4, and we can also find that the first command at the entry point is pushad.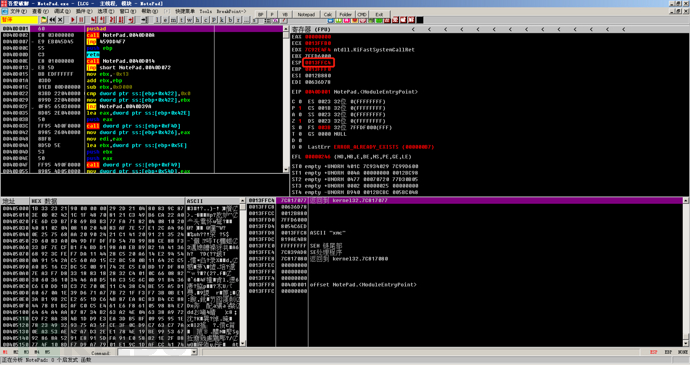
At this time, we first run pushad with F8, and find that the ESP value changes to 0013FFA4.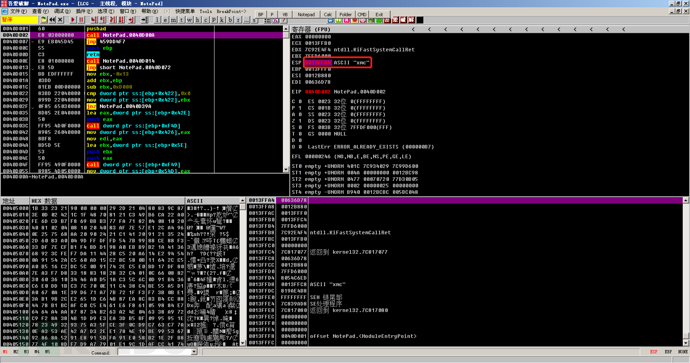
At this time, you can right-click ESP, select HW break [ESP], or follow the data window, right-click, add a hardware access breakpoint, and then run the program to the location shown in the figure below. At this time, it is recommended to cancel the hardware breakpoint to avoid subsequent access to this address.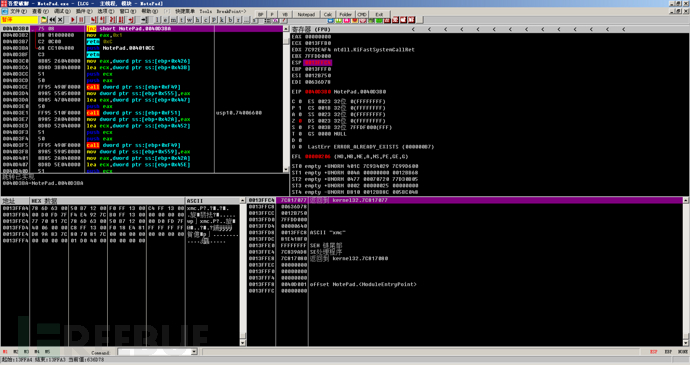
Then you can directly jump to the OEP with a single step, which is consistent with the single-step unshell method.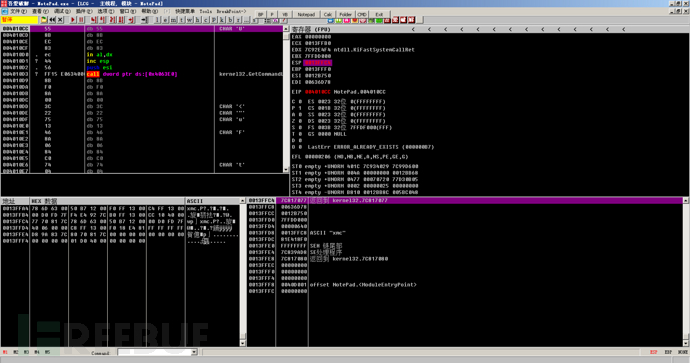
(3) Direct Jump Method
Many shells have the characteristic of jumping directly to the real OEP with an unconditional jump, so the real OEP can be found by looking for the machine code E9 of jmp. At the same time, since some shells have a pushad command at the beginning and a corresponding popad command at the end of unshell, the corresponding out-of-stack command can be found by looking for the push command at the beginning of the program to find the real OEP.
The shell example is still as shown above. We know that there is an instruction like pushad at the entry point, so it is likely to have a matching popad instruction for stack unrolling to restore the register environment. After loading, you can directly use Ctrl + F to search for popad instructions. Since there may be other popad instructions in the shell, you can use Ctrl + L to find the next popad until you find the one we need.
The first one does not seem to be very consistent, and the code around it does not meet the characteristics of the entry point code.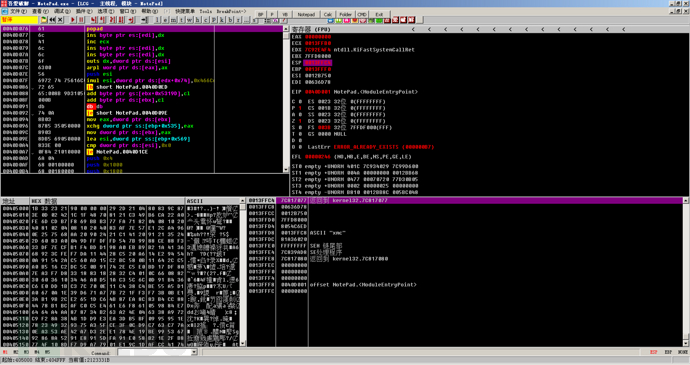
Then we keep looking for the popad shown in the figure, and find that it is the popad before the entry point.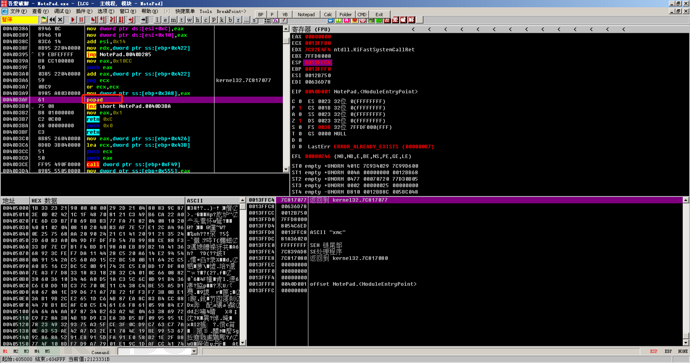
(4) Simulation tracing method
OD's command line plugin, tc/toc commands are trace step and trace step over, until the condition is met and the program is paused. Because the OEP is usually in the first segment, and the shell code is generally located in the later segments, we can simulate trace according to the segment information viewed by exepeinfo, etc. If the starting address of the second segment is 0x4F1000, we can use tc/toc eip < 0x4F1000 to let OD trace the program, which can usually directly trace to the OEP. However, since simulation tracing needs to judge whether eip meets the condition after each instruction is executed, it is slower. At the same time, if the shell code and OEP code are in the same segment, this method is not applicable.
The example environment is the same, load the program, press alt + m, and find that the code segment is at memory address 00401000 with a size of 4000. Therefore, the addresses of the code segments are all less than 00405000. We use the simulation tracing method and input tc eip < 00405000 to trace.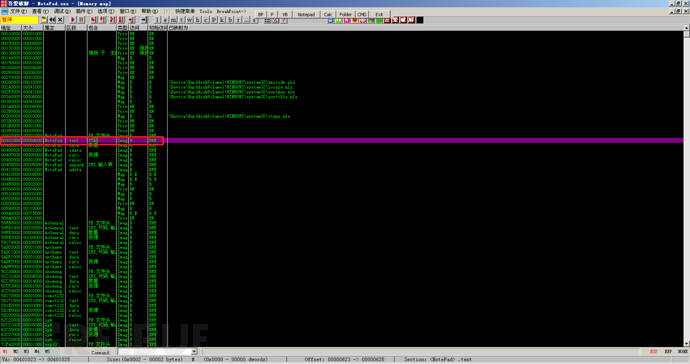
The tracing stopped in the middle, but it was found that this is not the OEP.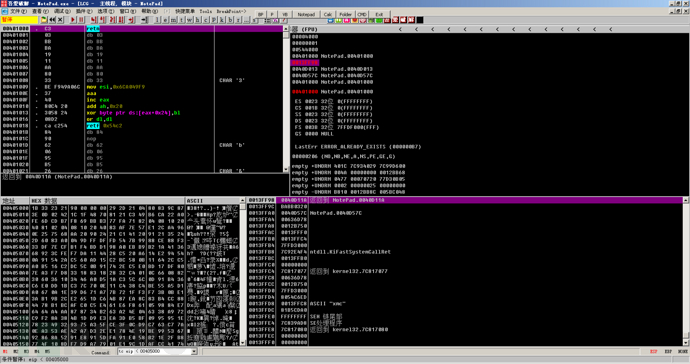
We press F8 to step one by one, and find that eip is greater than 0x00405000 again. At this point, we can continue to use tc eip < 00405000 to follow up.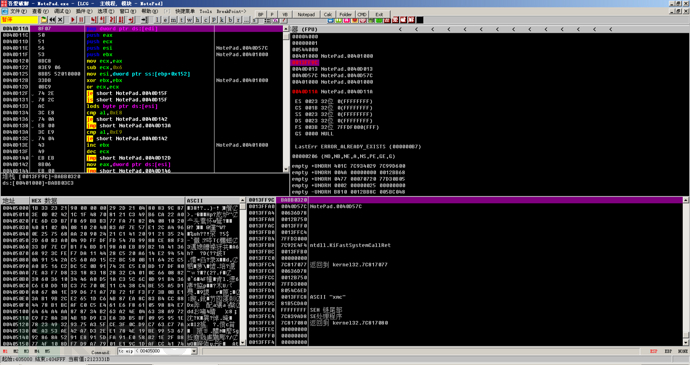
After the tracing is completed, it is found that it jumps directly to the OEP.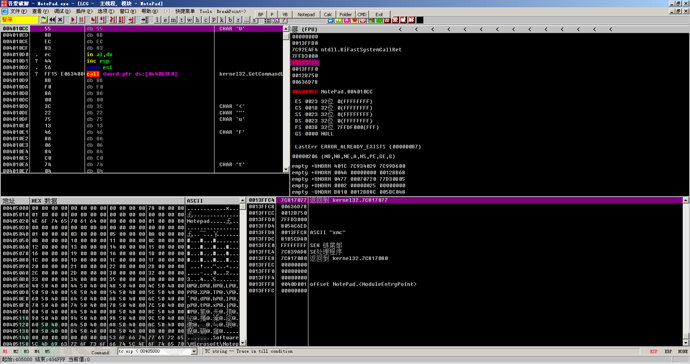
It can be found that if we do not understand why we need to set eip < 00405000, after the first execution ends and we find that we have not jumped to the OEP, we may not know how to proceed. A careful analysis will show that it is just a command located in the .text segment, and after jumping over it, we can use the command line to jump to the OEP.
(5) SFX method
The SFX method is similar to the simulation tracing method, but it does not require us to set conditions ourselves to stop the analysis. Instead, OD decides whether it has traced to the real entry point, including block mode tracing and byte mode tracing. Among them, block mode tracing is faster, but byte mode tracing is more accurate.
As shown in the figure, by selecting Options, Debug Options, and checking SFX, we can choose block mode tracing to get the OEP and byte mode tracing for the OEP. Here, we choose block mode tracing.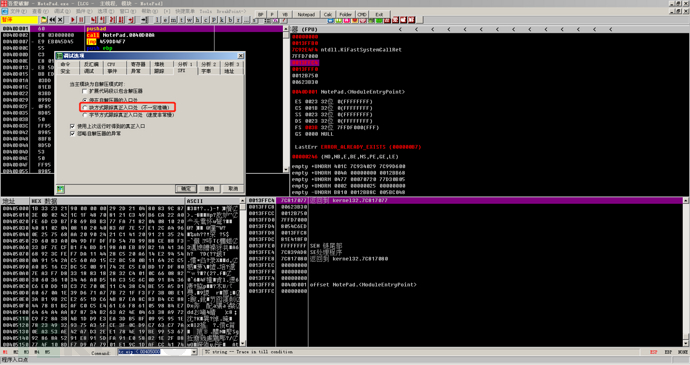
It can be found that this is not a real OEP, although it looks similar to the entry point of VC++, we can try to strip the shell, but the program cannot run normally.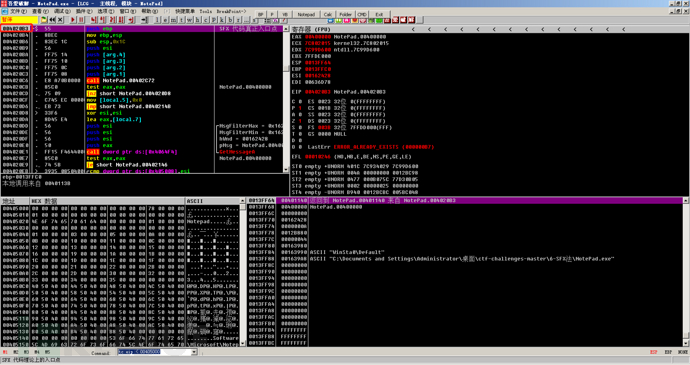
Then we use byte tracking to get the real OEP.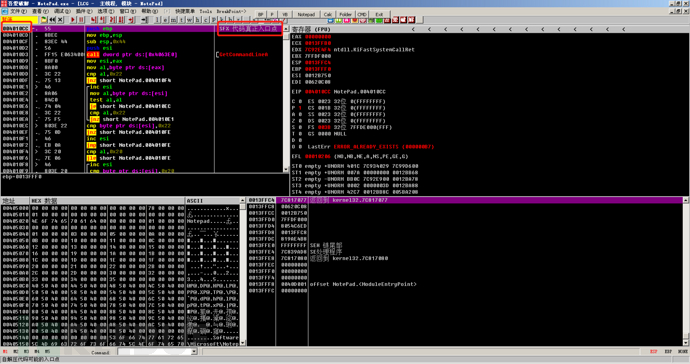
(6) Memory Image Method
The memory image method is to find the OEP by setting breakpoints on the segments in memory. Since the program must decrypt or decompress the necessary resource segment and code segment before running, some part of the shell code must exist to access or write requests to the resource segment and code segment. Therefore, we can sequentially set breakpoints on the program's resource segment and code segment and then track to the OEP.
The example of the memory image method uses ASProtect V1.23 shell.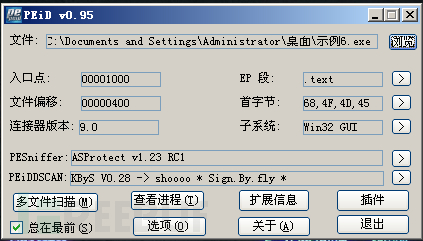
As above, use OD to load the program, and the program stops at the entry point.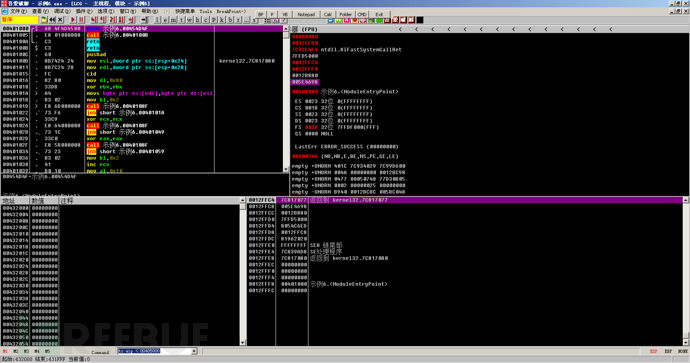
Then you can use alt + m to enter the memory interface, set a breakpoint on the resource segment, that is, the .rsrc segment, and then run.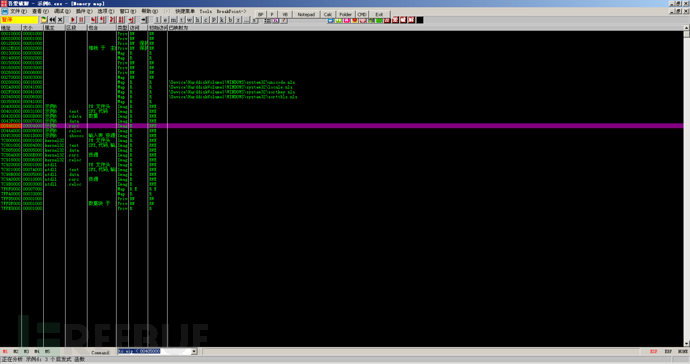
Then we continue to enter the memory interface, set a breakpoint on the .text segment, and then continue to run.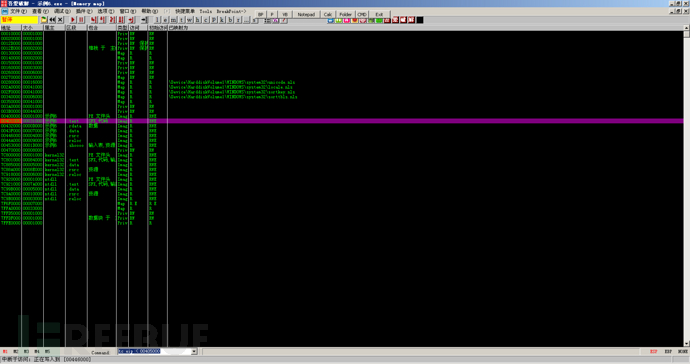
The program comes to the following interface, at this time, combine it with other methods, such as single-step tracking method, simulation tracking method, etc., for further analysis, we can get the OEP. Here the author uses the simulation tracking method for analysis, using tc eip < 00432000, and then successfully come to the OEP.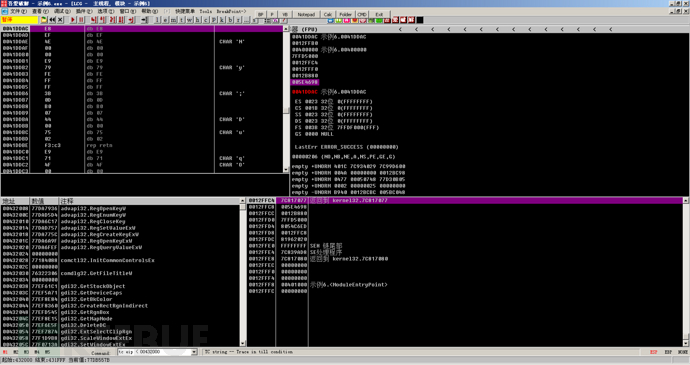
Since the memory image method is to set breakpoints on a segment, it is difficult to directly jump to the OEP through two breakpoints, but through this method, most of the decompression or decryption operations of the resource segment and code segment in front of the shell can be skipped. When the decompression is completed, if the eip returns to the code segment, it is basically at the OEP.
(7) Last Exception Method
Some packaging programs will set many exceptions when executing the shell code to interfere with the unpacking cracker, and they will detect breakpoints and perform anti-debugging in the exception handling programs of various exceptions. Therefore, if we still use the esp law, memory image and other breakpoint methods, they will be ineffective. We need to execute these exceptions first and then take the above measures. The last exception method is to find the instruction where the last exception occurs in the program, and when the last exception is executed, we can take the conventional method to find the OEP.
The example of the last exception method uses a PEencrypt packaged program.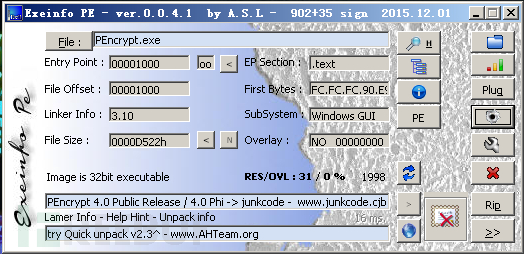
Similarly, load the program with OD and cancel all exceptions.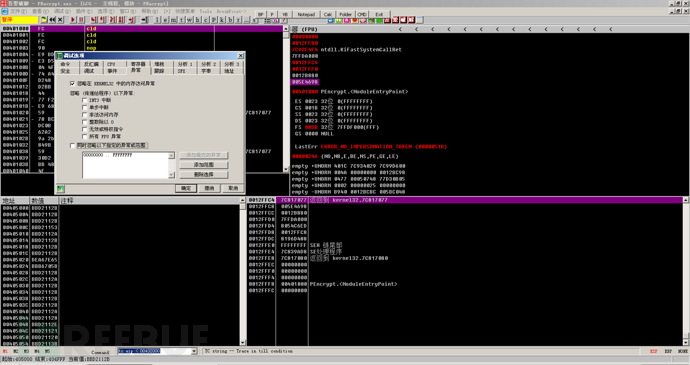
Then use shift + F9 to run, test how many times shift + F9 the program runs normally, this is to skip some exceptions triggered by anti-debugging in the front of the program. After testing, the program runs normally after two shifts + F9, so we reload it, press shift + F9 once to skip the exception triggered by anti-debugging, and then come to the following interface.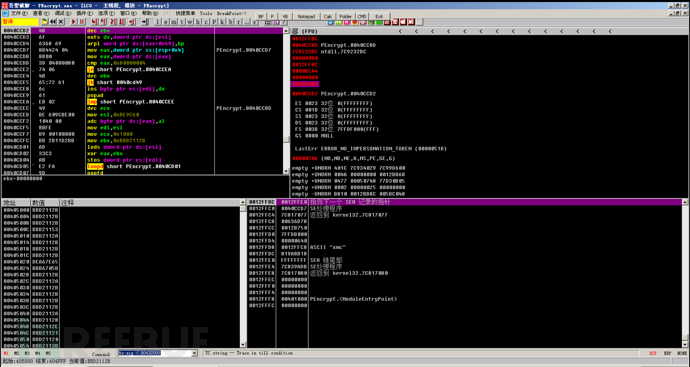
Then pay attention to the SE process address in the lower right corner, where the address is 0x4DCCD7. Press Ctrl + G, then set a breakpoint at this address, press shift + F9, and then remove the breakpoint. Then we can step through or simulate step through, here the author tries to simulate step through, and then quickly come to the OEP.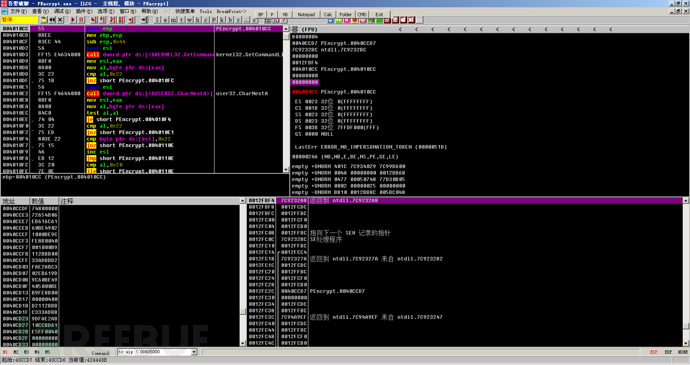
Many readers may ask why we need to set a breakpoint at the address of the SE handling program and run shift+F9 to ignore exceptions, because if we do not set a breakpoint here and run shift+F9 to ignore exceptions, the program will enter an exception and terminate, causing us to be unable to continue the analysis. Therefore, we need to use shift+F9 to jump to the exception handling program, and then continue the analysis.
(8) Using the first API called by the application
By setting a breakpoint on the first API called by the application to reach the vicinity of the OEP, we can further find the OEP. For example, GetVersion, GetModuleHandle, etc. It should be noted that the selection of this API function has certain skills. If the shell also calls this API function frequently, the location of this function will be very time-consuming, so it is necessary to select a function that is called less frequently in the shell and is commonly called near the OEP.
Here we choose the nspackV1.3 encapsulation program as an example.
First, we load the program with OD, based on the knowledge储备 from the early stage, we know that the functions that may be called near the entry point include GetVersion, which retrieves the operating system version, making it convenient for further adaptation and other operations based on the system version, so we use at GetVersion to jump to the first place where GetVersion is used.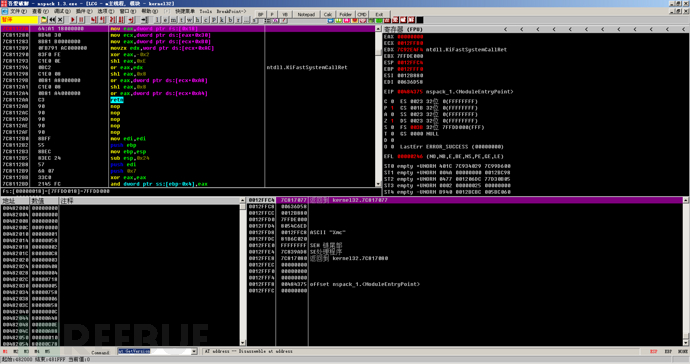
At this point, we are already in the code of the GetVersion call. We need to execute to the return address, return to the call of the GetVersion function, so we set a breakpoint at the retn statement, then run to that location, and then cancel the breakpoint.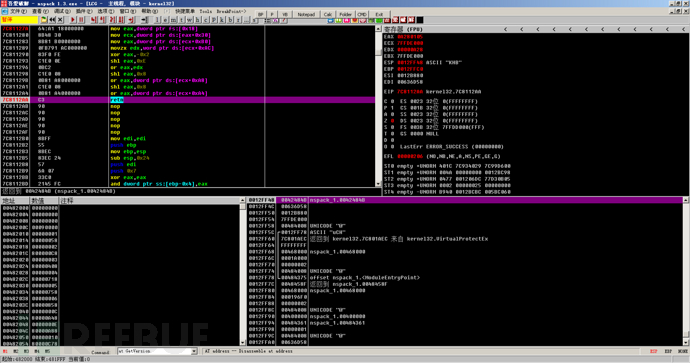
Then we can execute F8 to return to the code where the function is called. We know that these are the first few functions called after entering the OEP, so we need to look up for the OEP here.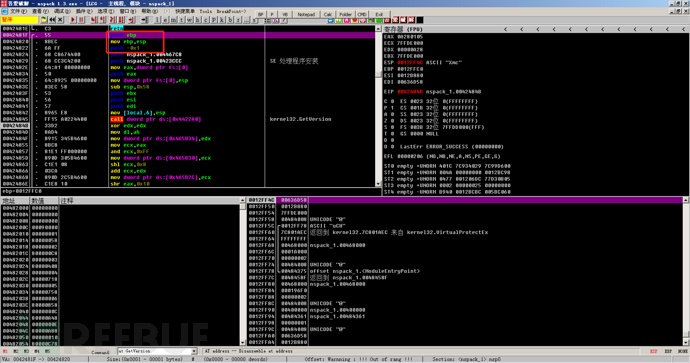
Then we found the entry point code characteristics of VC++, judged that this may be the OEP, tried to decapsulate for verification, and confirmed that it is indeed the real OEP.
2. Manual repair method for IAT
After manual decapsulation and finding the OEP and dumping the image file, since the IAT of the program will also be encrypted or compressed during the encapsulation process, it is necessary to repair the IAT to avoid function call errors.
(1) Automatic repair by ImportRCE
Here we still use the encrypted program of Beidou as an example. After the previous analysis, we have obtained the address of the OEP, and then we can use tools like LordPE to dump the target program.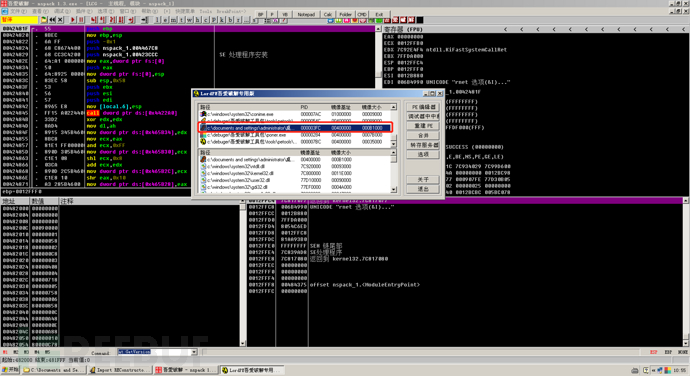
Then we can automatically repair the IAT using tools like ImportREC or manually locate the address and length of the IAT to repair it.
The automatic repair is shown in the figure below, just enter the OEP address, then click Auto Find IAT, get the input table, display invalid functions, and cut the invalid functions.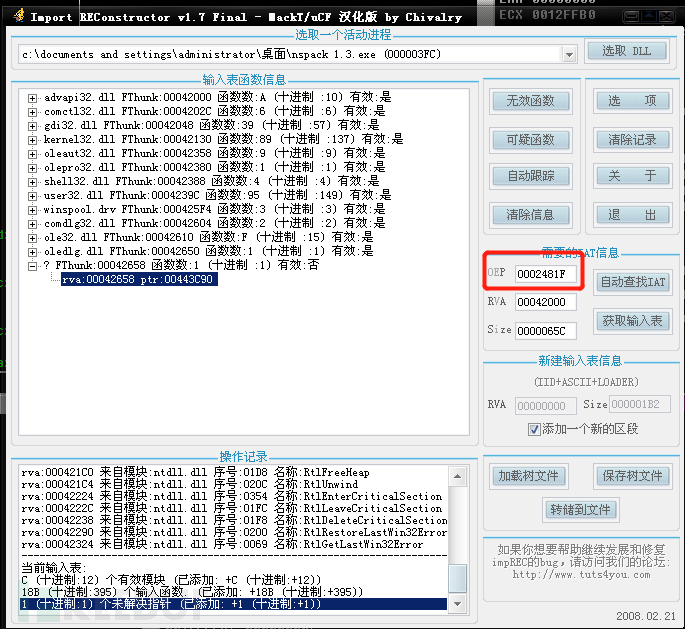
(2) Manual repair of IAT
If you want to manually locate the offset address of the IAT, you can use the following method.
For IAT calls, different linkers may use different methods. Here I take VC++6.0 as an example. VC++6.0 calls IAT using FF 15, so we can search for the binary string FF 15 near the OEP to find the IAT call address, as shown in the figure below: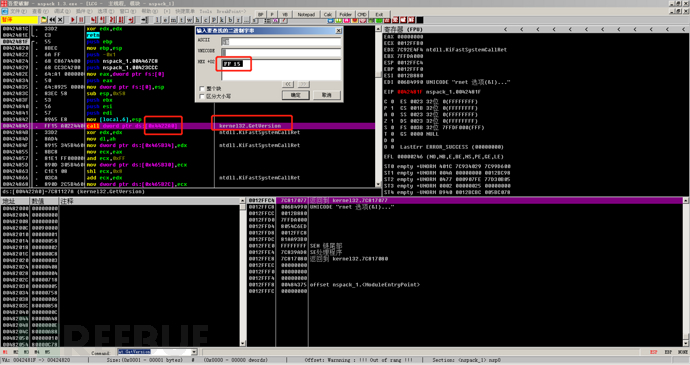
Then you can see that it calls the address 0x004422A0, and then we can follow up on this memory address in the command line, input dd 0x004422A0.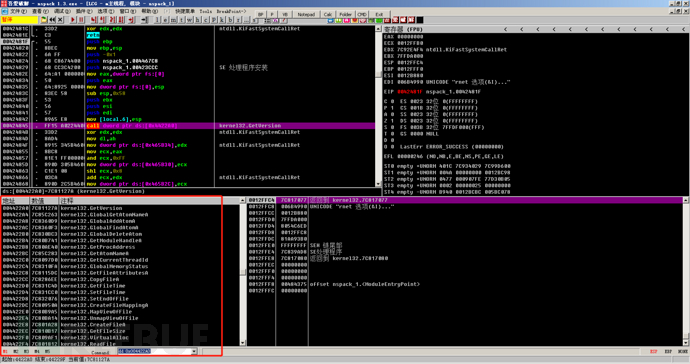
You can see many function addresses in the lower left corner. First, we go up to find the first place that is not a function address.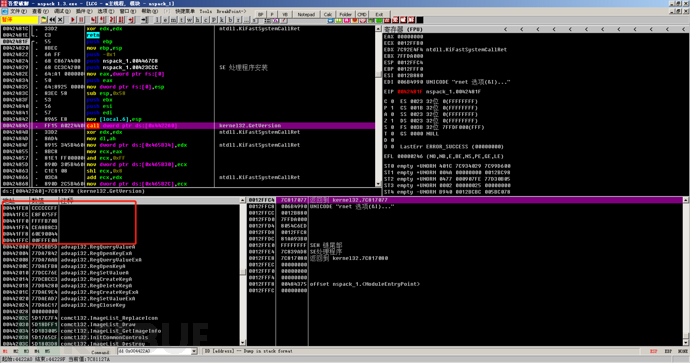
Since the address above 0x00442000 is all empty, it indicates that the starting address of the IAT is 0x00442000. Then we continue to search downwards to find the end address of the IAT to get the size of the IAT.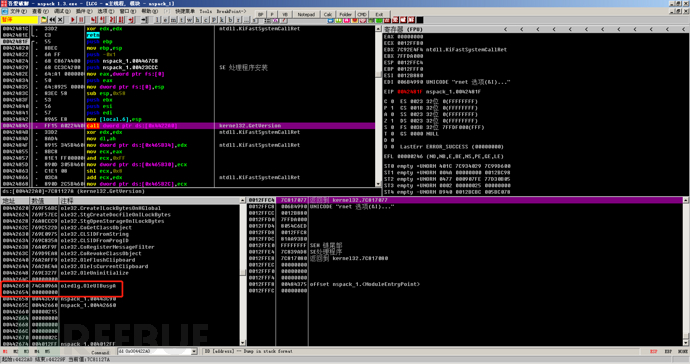
By searching downwards, we find that the end address is 0x00442654, so the IAT length is 0x654, which is consistent with the length found by ImportREC (ImportREC has an invalid pointer, so although the length written is 0x65C, the actual length after cutting the pointer is 0x654).
Similarly, you can also use the right-click->Find->All Module Calls to display the list of called functions.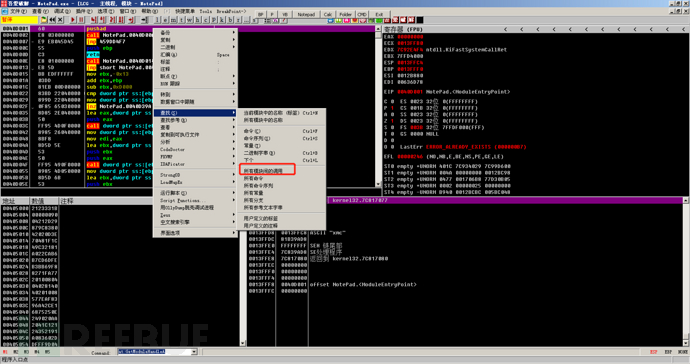
Then we double-click on one of the program's functions (the one circled in the picture is the program's function), do not click on the system function.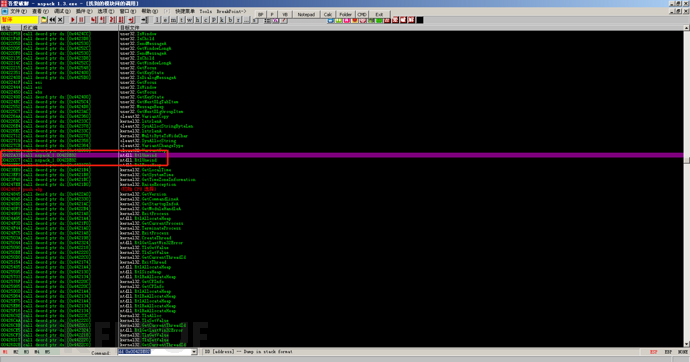
At this point, we come to the function call location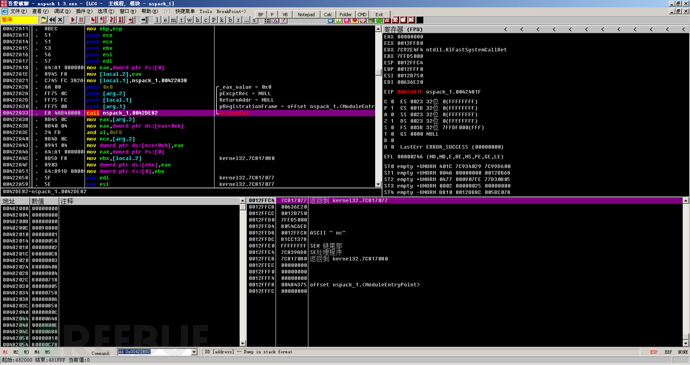
Then you can press Enter to enter the internal process of the function call. You can see that there will be calls to functions in the IAT table inside the function.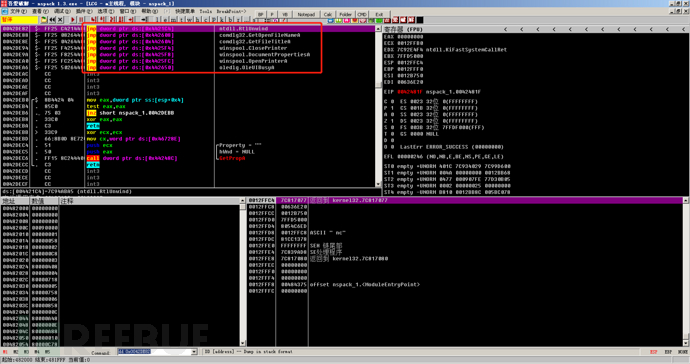
The process and method of finding the IAT table address are consistent with the previous description, and the introduction of the two IAT repair methods is completed here.
5. Summary
This article mainly introduces eight methods of manual decompiling, including step-by-step tracking method, ESP law method, etc., and it can be found that each method has its own advantages and some shortcomings. By analyzing the decompiling process of the example, it can be found that when decompiling a program, it is not necessary to be limited to using one method to decompile. Many times, combining multiple methods can make decompiling much simpler. For example, the step-by-step tracking method is a basic analytical method. For relatively complex packing programs, almost all need to combine the step-by-step tracking method with other methods to analyze. The ESP law method is suitable for some special shells, such as shells that use the stack to save the register environment.
The most important point when decompiling at the same time is to be familiar with various compilers and entry point features of various languages. Otherwise, even if the real OEP is tracked through decompiling methods, it may not be known that decompiling is possible. As part of the reverse engineering process, decompiling also requires much practice, accumulation of experience, and skillful mastery. It is hoped that all readers can also achieve the heights they want to reach as soon as possible.
Eight ways microlearning makes cybersecurity training more effective
Follow the Cybersecurity Medicine Water Brother to fight the target field (emergency response)
Eighth. Blind injection based on boolean header injection
hacker-earth-thoughtworks-hire(Thoughtworks)
1.2 The safety and compliance supervision requirements are becoming higher and higher
Are your thoughts being mined for data-

评论已关闭