With the escalation of the confrontation with black industries, mining own data has become an important weapon for the defense side, and machine learning has also become the magic weapon of the defense side.
The application of machine learning in risk control is different from general application scenarios, mainly reflected in the following aspects:
- The cost of labeling tags is high, leading to the fact that tags are sometimes even unlabelled.
- Bad guys will actively improve cheating strategies, leading to the failure of the inherent model.
- It is necessary to return results in real-time or nearly real-time.
- Scenarios are diverse: account hacking, scalpers claiming coupons, points walls, anti-crawling, etc.

There are basically three specific examples to illustrate how we use machine learning to solve specific problems faced by account risk control.
Firstly, with too many rules, how to alleviate the maintenance burden?
For risk control systems, rules often have an immediate effect, supplemented by expert experience, which can play an important role for a long time. However, as time goes by, more and more rules are added to the system, and more and more marginal conditions need to be weighed, even causing a situation where a slight change can affect the whole. How to better maintain these historical rules?
By analyzing these historical rules, we find that the rules are actually a kind of manual induction and quantification of anomalies, for example: if someone's IP address visits more than 50 times per minute and the login failure rate is greater than 90%, disable the IP address. Then, the better maintenance of the rule problem becomes: how to quantify anomalies given a sample and features? The preliminary problem we face is as follows:
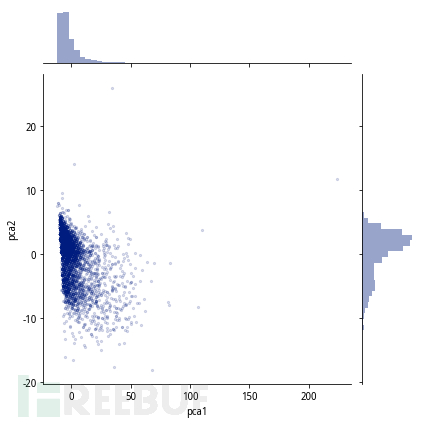
Considering the 'initiative' of unlabelled data and bad guys, we can choose unsupervised anomaly detection models to distinguish anomalies. Among them, the isolation forest model is the most effective. It can achieve the following effects:
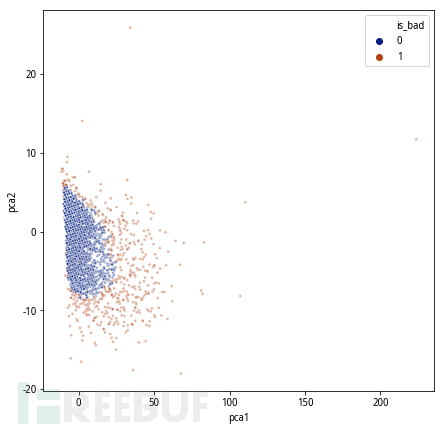
However, considering the complexity of online situations, we hope to score the degree of abnormality of the samples, combine historical data for strategy backtracking, flexibly determine thresholds, and thus achieve the best summoning, resulting in abnormal phenomena, thus achieving the effect of quantifying abnormalities:
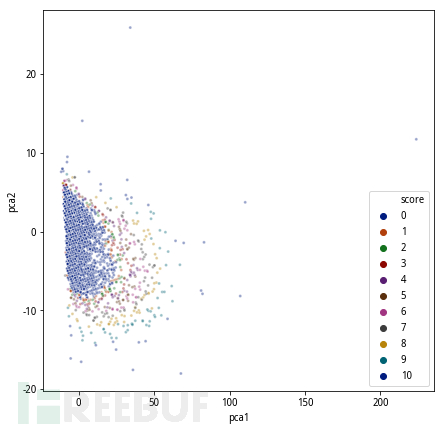
Finally, we have achieved the quantification of anomalies, thus improving the online rules. In this way, the maintenance of the rules has become the maintenance of features. As long as features and their combinations related to the model can be generated, the corresponding simplified anomaly model can be obtained, thus realizing flexible online rule management. Compared with the original rule interception partition, the coverage rate of the model has reached over 80% of rule interception, and the recall rate has increased by over 70%.
Second, unconscious captcha
With the escalation of confrontation, the captcha is becoming increasingly ineffective in distinguishing between humans and machines. The cracking methods used by the attackers have also long been upgraded from manual captcha to deep learning captcha. Even ordinary people have to sigh in the face of the captcha: Can such a captcha really be answered by humans? Maybe only machines can answer it.

Since the captcha cannot prevent machines and also hinders normal users, are there more user-friendly methods that can replace the captcha? Here we introduce human-computer recognition, which uses phone sensors to complete human-computer distinction without the user's awareness.
Smartphones contain various sensors, such as acceleration sensors, angular velocity sensors (gyroscope), gravity sensors, and magnetic field sensors. At every moment when the phone is running, these sensors collect data at frequencies of hundreds or even thousands of hertz. So, can these sensor data be separated into human/machine? Gradually, the bad guys can manipulate the phone API or external force to make the phone produce physical behavior, thus generating sensor data representing motion states. For the bad guys, the operations they can choose include: when the phone is stationary, when the phone is vibrating, and when the phone is placed in a swing device. We have collected the sensor data generated in these scenarios and can make a visual comparison of the following 4 pictures:
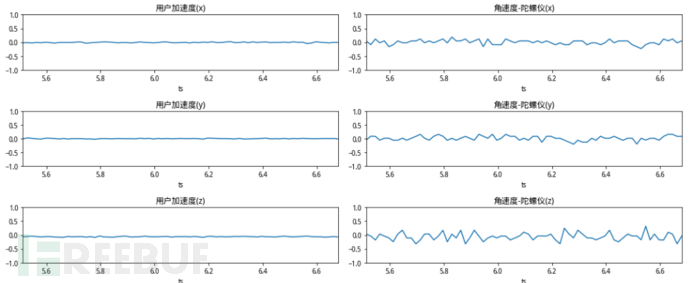
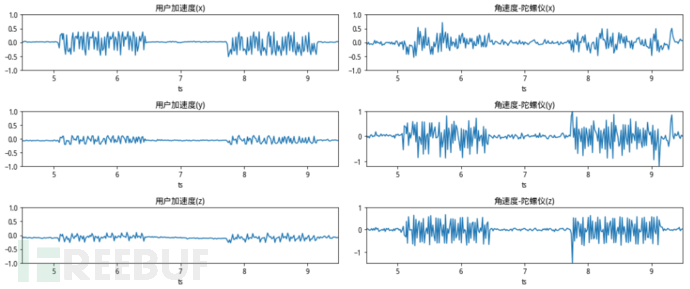
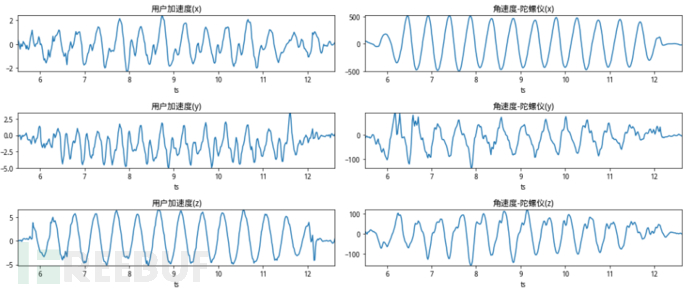
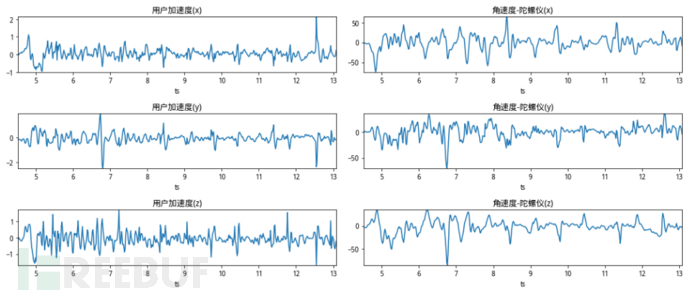
The operations corresponding to the figure from top to bottom are: phone stationary, phone vibration, phone swing, and normal click operation. It can be seen from the figure that the sensor still has slight distortion when stationary, the sensor fluctuation has regularity when vibrating, the sensor data in the swing is very similar to a sine wave, and the normal click operation brings a sharp rise or fall in acceleration through the finger's touch operation. From this, it can be inferred that distinguishing whether the sensor data is generated by humans is more accurately said: whether a certain sliding or clicking interaction operation is generated by the current sensor, which is exactly suitable for the binary classification problem that machine learning can judge.
Ultimately, it is the human-computer recognition model that can determine whether the sensor data collected by the SDK is generated by humans. From the online interception effect, the overall accuracy rate is 97.3%, with 1.8% of good people mistakenly intercepted.

From the perspective of confrontation, the main purpose of human-computer recognition is to reduce the entry threshold for good people, while improving the biological entry threshold for evil people is only a supplementary and secondary goal, because the security of human-computer recognition strongly depends on the security of the SDK. Once the SDK is involved in practice, we will add multiple features for collection in the SDK, thus transforming the role of the probe and bringing the main battlefield back to the body.
Three, post-event early warning mechanism
Risk control is usually divided into three parts: pre-event, in-event, and post-event. Considering real-time performance, it is difficult to achieve high recall for pre-event and in-event interception. However, even in the post-event stage, if we can discover anomalies early and form an interception strategy with high accuracy, it is still cumulative.
We know that the behavior of the bad guys often shows clustering, which may be the aggregation of devices, IPs, etc., or the synchronicity of behavior: a group of UID doing the same thing at the same time. This clustering and synchronicity are very similar to the clustering of infected attributes and the synchronicity of behavior during an outbreak of an infectious disease: all live in a specific area, all have been to a public place. And the timely post-event early warning in the risk control scenario is very similar to the problem faced by public health institutions when dealing with infectious diseases such as COVID-19: how to detect the outbreak of an epidemic in time and lock in a large number of newly infected people?
We assume that health institutions have collected the following patient consultation information (part):
|
Name |
Gender |
Symptoms |
Residential community |
Workplace |
Time of consultation |
|
Zhang San |
Male |
Cold |
1st Street |
Vegetable market |
2020/1/4 |
|
Li Si |
Female |
Pneumonia |
22 Road |
Seafood market |
2020/1/5 |
|
Wang Wu |
Male |
Pneumonia |
Changjiang Family Dormitory |
Fruit and vegetable market |
2020/1/5 |
|
Zhao Liu |
Female |
Pneumonia |
Huanghe Village |
Seafood market |
2020/1/6 |
|
Qian Qi |
Male |
Pneumonia |
Jianghan Road |
Seafood market |
2020/1/6 |
For example, when the number of pneumonia patients increased significantly in 2020W1, to locate this abnormal item, it is necessary to count the same indicators in the same period of history (last week, last month, last year), and use statistical tests (chi-square test/Fisher's exact test, etc.) to determine the difference between the current indicator and the historical indicator (p-value). It can be seen that in our previous data, the number of pneumonia patients in 2020W1 was significantly higher than that in the same period in history, and the first step is completed.
|
Time |
Total number of respiratory patients |
Pneumonia patients |
p-value |
|
2019W1 |
100 |
8 |
0.0193 |
|
2019W48 |
120 |
8 |
0.0052 |
|
2019W52 |
160 |
15 |
0.0187 |
|
2020W1 |
200 |
40 |
1 |
After discovering abnormal indicators, we also hope to locate the source of the infectious disease and the close contacts. In epidemiology, of course, what is needed is an epidemiological investigation, the key of which is to find the source of infection and the mode of transmission. For risk control, it is necessary to find the intricate connections between the bad guys. We usually do this step by step: the closer the contact with the bad guys, the more likely they are to be bad.
For such problems, it is natural to think of graph-related technologies. In the context of infectious diseases, graph technology can identify close contacts centered around seafood markets. In the risk control scenario, we can also use graph association analysis to expose the bad guys in practice. We found that the Louvain community detection algorithm does not require data annotation, runs quickly, is accurate, and has better performance.
On the whole, it is helpful for machine learning algorithms. The defense side resets the massive data it possesses and mines more insights and cognition, maintaining a more proactive position in defense.

评论已关闭