Author: Korean HAN from JD Technology
First, problem discovery and investigation
1.1 Find the cause of the problem
The cause of the problem was that we received a CPU alert from the jdos container, with the CPU usage rate reaching 104%
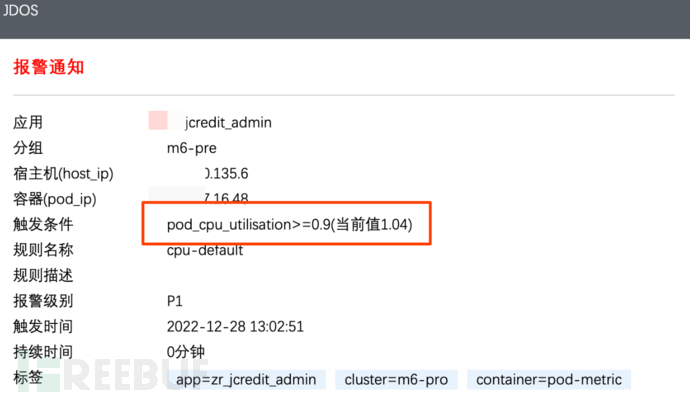
By observing the machine logs, it was found that at this time, there were many threads executing batch tasks. Normally, batch tasks are of low CPU and high memory type, so it was considered that it was caused by a large amount of CPU usage due to FullGC (there was a similar situation before, and after notifying the user, restarting the application solved the problem).
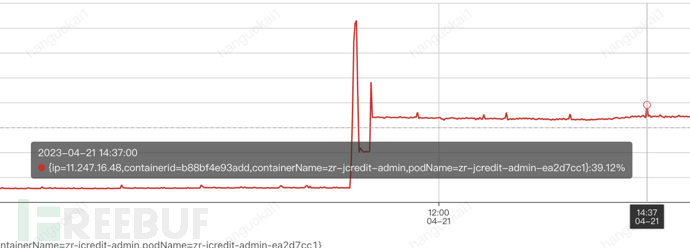
Check the memory usage of the machine through TaiShan:
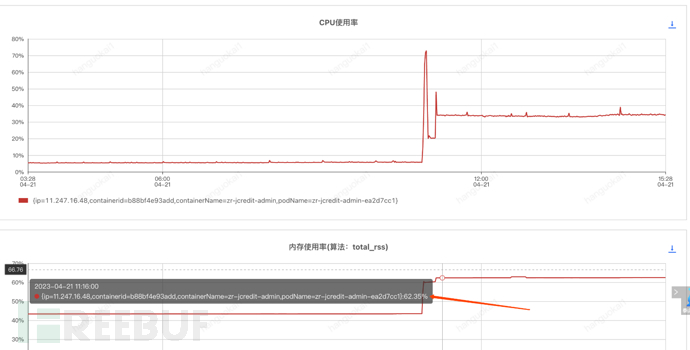
It can be seen that the CPU usage rate is indeed high, but the memory usage rate is not high, only 62%, which is within the normal range.
By this point, it was actually a bit confusing. According to logic, the memory should have been full by now.
Later, based on other indicators such as the sudden surge in traffic, I also suspected that the jsf interface was suddenly heavily called, leading to CPU saturation, so the memory usage was not high. However, all these were gradually ruled out later. In fact, there was a bit of a dead end here, as the phenomenon did not match the guess, only CPU growth without memory growth. What could cause one-sided CPU growth? I then investigated in this direction for a long time and all were denied.
Suddenly realized later on that,Could it be that there is a 'problem' with the monitoring?
In other words, the problem with the monitoring we see is that this monitoring is the monitoring of the machine, not the JVM!
The CPU usage of JVM can be reflected on the machine, but the high memory usage of JVM after the high CPU usage is not very obvious on the machine.
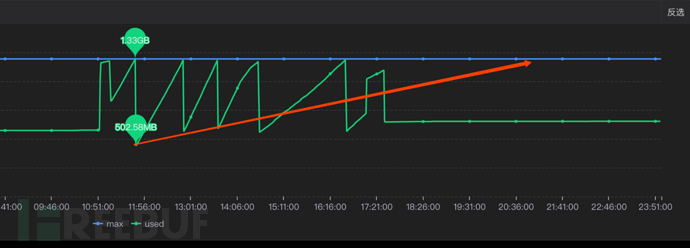
Then go to sgm to check the corresponding node's JVM related information:
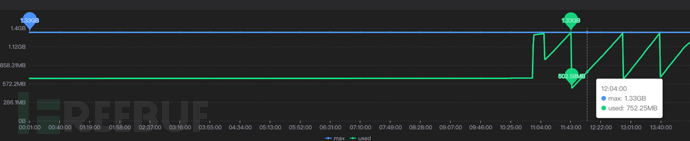
You can see that our old generation of heap memory has indeed been filled and then cleared, and checking the CPU usage at this time can also correspond to the GC time.
So at this point, it can be determined that the problem is caused by Full GC.
1.2 Find the cause of FULL GC
We first took heap memory snapshots before and after gc,
Then use JPofilerPerform memory analysis. (JProfiler is a heap memory analysis tool that can directly connect to the online JVM in real-time to view relevant information, or analyze the dump of heap memory snapshots to analyze the heap memory status at a certain moment)
Firstly, decompress the file we dump out and change the file extension.binThen open it. (We use the dump tool built-in to XyCloud, or you can manually dump files on the machine through commands)

Firstly, select the Biggest Objects to view the largest few objects in the heap memory at that time.
From the figure, it can be seen that the four List objects occupyAbout 900MB of memoryAnd the heap memory we just saw is only 1.3GB, so adding other objects easily fills up the old generation and triggers a full gc problem.
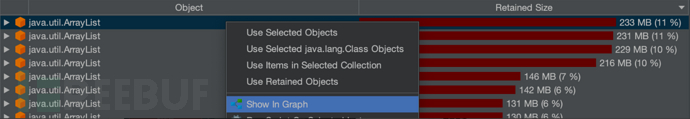
Select oneThe largest object is the object we want to view
At this point, we have already located the position of the corresponding large memory object:
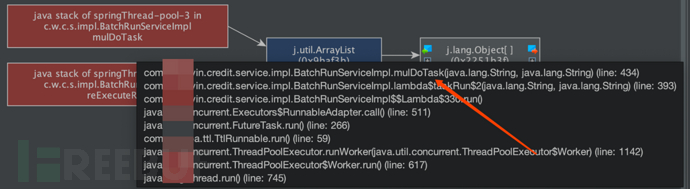
In fact, by now, we have been able to roughly locate the problem, and if you are still unsure, you can view the specific object information as follows:
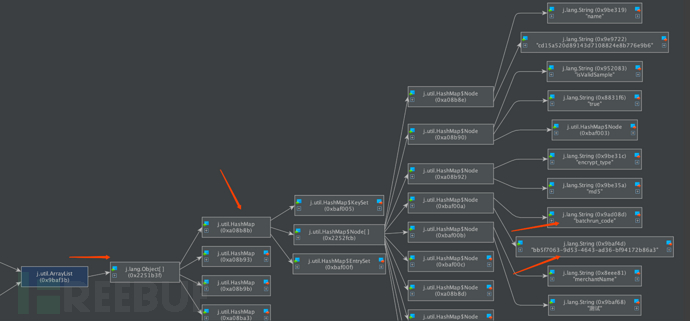
You can see that our large List object is actually composed of many Map objects, and each Map object contains many key-value pairs.
Here you can also see the relevant property information in the Map.
You can also see the relevant information directly in the following interface:

Then you can see the corresponding properties by clicking through.
By now, theoretically, we have found the location of the large object in the code.
Secondly, problem solving
2.1 Find the location and the root cause of the problem in the code for the large object
Firstly, we find the corresponding position and logic based on the above process
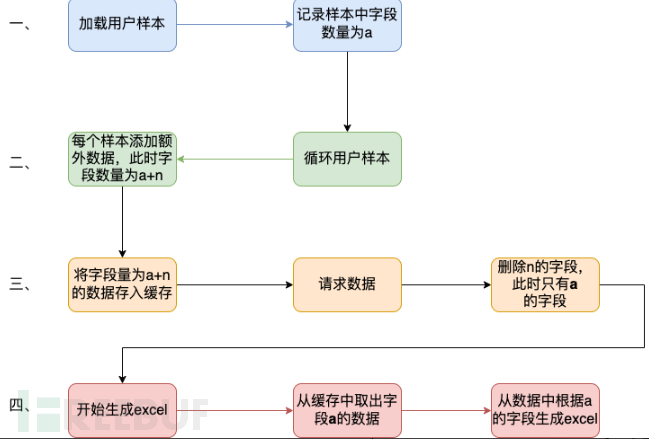
The logic in our project is roughly like this:
- Firstly, it will parse the Excel sample uploaded by the user and load it into memory as a List variable, which is the variable we mentioned above. A sample of 20w, at this time, the number of fields is a, and it occupies about 100mb of space.
- Then traverse the user samples in a loop, based on the data in the user samples,Add some additional request dataAccording to this data, request related results. At this point, the number of fields is a+n, and the occupied space is already around 200MB.
- After the loop is completed, store this 200MB of data into the cache.
- Start generating excel, take out 200MB of data from the cache, and fill the initial sample fields into excel according to the a fields recorded previously.
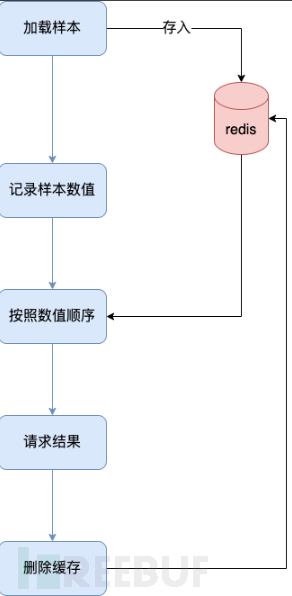
Represented by a flowchart:

Combined with some specific troubleshooting images:

One phenomenon is that the minimum memory after each GC is gradually increasing, corresponding to the second step in the above steps, the memory is gradually expanding.
Conclusion:
Load the user-uploaded excel sample into memory and treat it as a List<Map<String, String>>is stored,Firstly, a 20MB excel file stored in this way will occupy about 120MB of heap memory.This step will occupy a large amount of heap memory,And due to the logic of the task, this large object memory can exist in the JVM for as long as 4-12 hours.which can easily fill up the JVM heap memory once there are too many tasks.
Here are the reasons why using HashMap can cause memory expansion, the main reason being the relatively low storage space efficiency:
Memory calculation of a Long object: In the HashMap<Long, Long> structure, only the two long integer data stored as Key and Value are effective data, a total of 16 bytes (2 × 8 bytes). After these two long integer data are wrapped into java.lang.Long objects, they each have 8 bytes of MarkWord, 8 bytes of Klass pointer, and an additional 8 bytes to store the long value (a wrapped object takes up 24 bytes).
After these 2 Long objects form a Map.Entry, an additional 16-byte object header is added (8-byte MarkWord + 8-byte Klass pointer = 16 bytes), followed by an 8-byte next field and a 4-byte int hash field (8-byte next pointer + 4-byte hash field + 4-byte padding = 16 bytes). To align, an additional 4-byte padding must be added, and finally, there is an 8-byte reference to this Entry in the HashMap, so adding two long integers actually costs 88 bytes of memory, the space efficiency is the effective data divided by the total memory space, that is, 16 bytes / 88 bytes = 18%.
——《Deep Understanding of Java Virtual Machine》5.2.6
The following is the heap memory object dump from the just uploaded excel, which occupies 128mb of memory, while the actual uploaded excel is only 17.11mb.


Space efficiency 17.1mb/128mb≈13.4%
2.2 How to solve this problem
Let's not discuss whether the above process is reasonable, and the solutions can generally be divided into two categories,One type is to address the root causeThat is, not to storeThe object is placed in the JVM memoryInstead, store it in the cache, and the problem of large objects in memory will naturally be resolved.Another type is to address the symptomsThat is, to reduce the size of this large memory object, so that it will generally not trigger frequent full gc problems in daily use scenarios.
Both methods have their pros and cons:
2.2.1 Aggressive treatment: Do not store it in memory
The logic to solve this is also very simple, for example, when loading data, store it one by one in the redis cache according to the sample data, and then we only need to know how many items are in the sample, and retrieve the data in the order of the number from the cache to solve this problem.
Advantage: It can fundamentally solve this problem, and this problem will basically not exist in the future. For larger data volumes, only the corresponding redis resources need to be added.
Disadvantage: First, it will increase a lot of redis cache space consumption, and secondly, from the perspective of display, the code here is old and obscure for our project, and the changes require a large amount of work and regression testing.
2.2.2 Conservative treatment: Reduce its data volume
Analyzing the above process of 2.1, the third step is completely unnecessary, first storing it in the cache and then retrieving it, which unnecessarily occupies cache space. (Guessing it is a historical issue, and it will not be further investigated here).
Secondly, in the second step, the extra field n is unnecessary after the request is completed, so it is considered to delete the unnecessary fields after the request is completed.
There are also two solutions at this time, one isOnly delete the unnecessary fields to reduce the size of the mapAnd then pass it as a parameter to the excel generation process;Another method is to delete the map directly after the request is completedThen read the user-uploaded excel sample again when generating the excel.
Advantage: The changes are relatively small, and no complex regression tests are required
Disadvantage: In extreme cases of large data volume, there is still a possibility of full gc occurring
The specific implementation method will not be expanded.
One of the implementation methods
//Get useful fields
String[] colEnNames = (String[]) colNameMap.get(Constant.BATCH_COL_EN_NAMES);
List<String> colList = Arrays.asList(colEnNames);
//Remove unnecessary fields
param.keySet().removeIf(key -> !colList.contains(key));
Three, expansion thinking
Firstly, the monitoring chart in this article is the common gc that is manually created when reproducing the scene at that time.
In the CPU usage chart, you can observe that the time of CPU usage rising indeed matches the time of gc.But there was no 104% CPU usage in the scene at that time..

In fact, the direct cause is relatively simple, because although the system has appeared full gc, it has notFrequentOccurred.
Low frequency full gc in a small range does not cause the system's CPU to spike, which is also the phenomenon we have seen.
Then what was the cause of the scene at that time?
As mentioned above, we inLarge objects in the heap memory will gradually expand as the task progresses.Then when our tasks are enough and the time is long enough, it may lead to the available space becoming smaller and smaller after each full gc, and when the available space is small to a certain extent,After each full gc is completed, we find that there is still not enough space to useIt will trigger the next gc, resulting in frequent occurrence of the final result and causing the CPU frequency to skyrocket.
Four, troubleshooting summary
- When we encounter the situation of high CPU usage online, we can first check whether it is caused by full gc, and pay attention to the JVM monitoring or use jstat related commands to view it. Do not be misled by machine memory monitoring.
- If it is confirmed that the problem is caused by gc, it can be connected to the online JVM directly through JProfiler or analyzed offline after saving a heap snapshot with dump.
- Firstly, we can find the largest object, which is generally caused by a full gc in most cases. There is also another case that it may not be as obvious as four large objects, but may be a more balanced ten or so objects of 50mb, and the specific situation still needs to be analyzed specifically.
- After finding the object with the problem through the above tools, find the corresponding code location of its stack, and find the specific cause of the problem through code analysis.Deduce and guess whether the phenomenon is correct through other phenomena.and then find the real cause of the problem.
- Solve the problem according to its cause.
Of course, the above is just not a very complex troubleshooting situation. Different systems definitely have different memory situations, and we should analyze specific problems specifically. What we can learn from this issue is the thinking process for troubleshooting and solving problems.
4.3. List API: Display all objects (object) that a user can access
AI Large Model Security: Prompt Injection Attack (Prompt Injection Attack)
1.1 Create user objects from the Active Directory Users and Computers console
Development of Burp plugin for sensitive information detection based on deepseek local large model
2. The related concepts and demands extended from the identified subject

评论已关闭