Author: Liu Jiangbo, JD Logistics
I. The purpose of regular performance testing construction
Why do we need to conduct regular performance testing?
The main problem currently faced is:Performance issues are discovered lateBringing uncontrollable risks to the major promotion. At present, daily demand iteration is frequent, and many factors such as system configuration changes, changes in upstream and downstream dependencies, and server resource replacement will have a certain impact on system performance; it is difficult to carry out load testing for all new projects or demand launches before and after, which often leads to many performance issues being discovered only during the major promotion load testing period.
The preparation for major promotion is time-consuming and task-intensive, and the pressure of load testing preparation is great,In the 11.11 review, some departments' working hours statistics, load testing accounted for a large part of the workload. Moreover, compared with other issues, performance issues have a higher optimization difficulty and longer repair cycle, and frequent system optimization under the situation of multiple parallel resources and tight preparation for major promotions brings uncontrollable risk factors to the entire major promotion.
Based on this,Introduce the means of regular load testingThrough regular load testing behavior every week or month, continuously control the performance of the system, ensure service stability; at the same time, the demand launch caused byPerformance issues are exposed in advance,Timely positioning and optimization of problems; reduce the preparation pressure and improve the efficiency of load testing.
Second: Regular load testing implementation process
2.1 Regular load testing
Regular load testing is an automated load testing behavior carried out at a certain cycle or specific trigger conditions, and aims to monitor performance indicators and detect service performance degradation risks in a timely manner through periodic load testing of single containers / clusters.
2.2 Implementation strategy
Through the three-step approach, from shallow to deep, gradually land the regular load testing in the technical department of the platform:
First step: Single machine pilot:Due to the initial use of regular load testing, throughIsolation of single machine environmentUnderstood the load testing ideas, execution process, load testing platform capability support, and risk point investigation of regular load testing,
Second step: Cluster pilot: Select star core services in performance and basic platforms,In the online environment pilotSmall cluster (2-3 machines) regular load testingTask execution, from the impact on online business, upstream and downstream dependency impact, load testing platform capability support, and online load testing risk control, etc., to evaluate the regular load testingOnline cluster deploymentFeasibility of the online cluster deployment
Third step: Comprehensive promotion:Based on the online regular load testing cluster practice of performance and basic platforms,Promote to the technical department of the entire platform,And combine the Kit load test tool to establish a core service performance data dashboardSummarize and analyze the performance report of the load test results, making the service performance trend visually presented; Open the green channel for major promotion load testing, regular load testing services that meet the standards, and major promotion load testing green channel.
2.3 Implementation process
Regular load test interfaces: Prioritize the core interfaces covering the main business process and the interfaces with star certification in the core services of ops-review.
Selection criteria for load test template task:
1) Set the load test template task based on the peak traffic model of major promotions and the usage of server resources;
2) Sort the interface call dependencies, set the load test template from the perspective of call volume, combining the worst-case downstream dependency carrying capacity and the performance of the interface itself;
3) For services without downstream dependencies, establish load testing templates from the perspective of the system's own best processing capabilities, from throughput or CPU perspectives;
Load testing frequency: for long and complex links, it is recommended to execute daily; for self-closed systemsIt is recommended to execute according to the online frequency.
Load testing window period:And confirm with the business and R&D during the off-peak period, specify the execution time for routine load testing tasks.
Load Testing Environment:Production environment single machine or small cluster for routine load testing.
Load Testing Data:It is recommended to use R2 records the real traffic onlineAs input parameters for routine load testing, ensure the effectiveness of load testing results.
Load testing results:The test team on duty follows up on each load testing result, continuously tracks bugs that do not meet the standards, and collaborates with R&D for performance analysis, problem investigation, and load testing task maintenance.
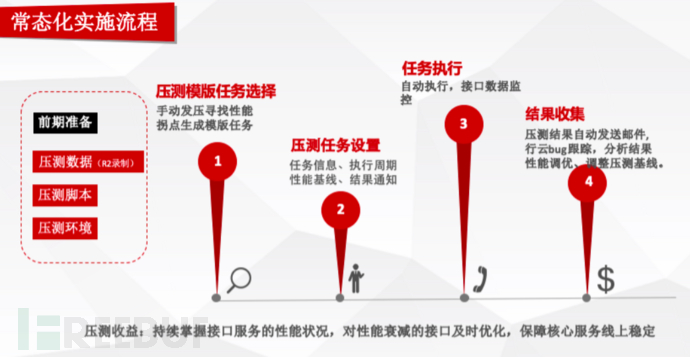
Load testing tools: forcebotRoutine load testing and R2
3. Routine Planning
・Carried out routine load testing points in fulfillment and basic in Q1 2023, formed best practices, and shared technical empowerment.
・Promoted to Q2 2023Platform technology department- The core of the platform technology department was completed before the 618 big promotion for the distribution and trading line 0-level read service 125Routine load testing construction based on jdos3.0.
4. High-fidelity load testing based on traffic recording
After the Double Eleven promotion, an important link in the preparation for the promotion is to carry out load testing on various core service systems to ensure system stability during the promotion period, and at the same time, provide data support for promotion expansion based on load testing results. So how to carry out high-fidelity load testing to make the load testing results closer to the actual performance of the online service? In the entire load testing process, the preparation of load testing data is a very important link, which largely determines whether the load testing results are true and reliable;
With the continuous development of business, not only have user traffic and business scenarios become increasingly complex, but the service call relationships and modules have also become more numerous, and data construction has become more difficult. Simple datasets cannot simulate real online business traffic, and unrealistic traffic ratios can easily lead to distorted load testing results.
Currently, major companies generally adopt traffic recording methods for module-level load testing or full-link load testing. They first store the recorded traffic, then edit and filter the traffic, and finally send pressure to the tested service through a load testing engine. This chapter, in combination with the Forcebot load testing platform, introduces in detail how to use the R2 platform to record online traffic for high-fidelity load testing.
4.1 Traffic Recording Load Testing
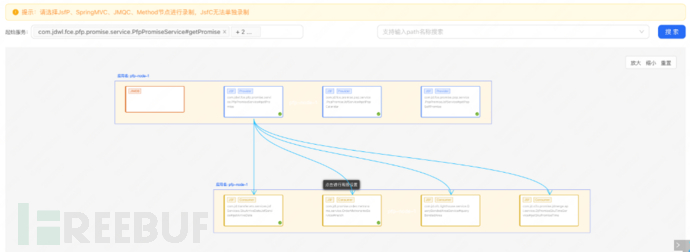
The basic framework diagram for recording online traffic for load testing using the R2 platform is as follows:
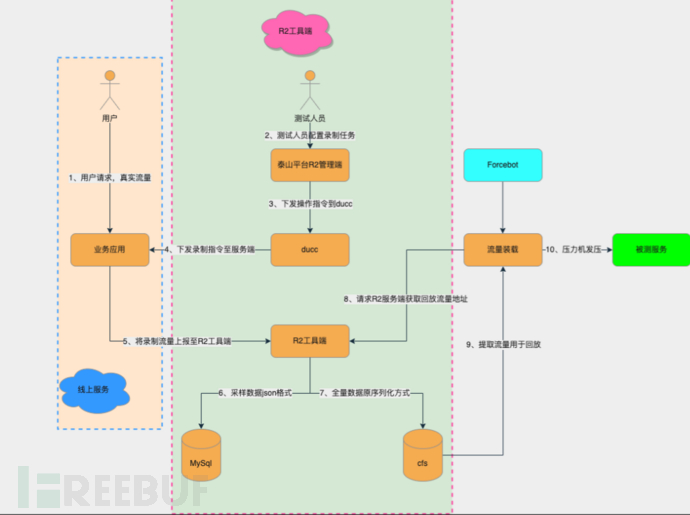
1. Users access the online service, generating real traffic based on user activities;
2. Testers create recording tasks on the TaiShan platform R2 tool management end, issue operation instructions to ducc when the task starts, and then send recording instructions to the online service end (the online service has already opened pfinder and connected to the R2 platform) to start recording online traffic;
3. The recorded traffic will be reported to the R2 tool end and the data will be stored.
4. After the traffic recording is completed, you can create a load testing script on the Forcebot load testing tool platform, Forcebot platform has been connected to the R2 platform, request the R2 service end to obtain the replay traffic address, and carry out traffic recording loading;
5. After Forcebot platform gets the traffic, it can be normally sent to the tested service through the pressure machine to execute the load testing task.
4.2 Record Load Testing Traffic
According to the system architecture and load testing scenario analysis, select the interfaces and scenarios that need to be recorded for traffic.
• If only a single interface is considered during load testing, then recording the traffic of a single interface is sufficient;
• Some applications have multiple core interfaces that require mixed scenario load testing, and multiple interface traffic need to be recorded simultaneously during traffic recording;
• Of course, you can also set the recording task to record only the traffic that meets a certain specific business scenario for requests or responses;
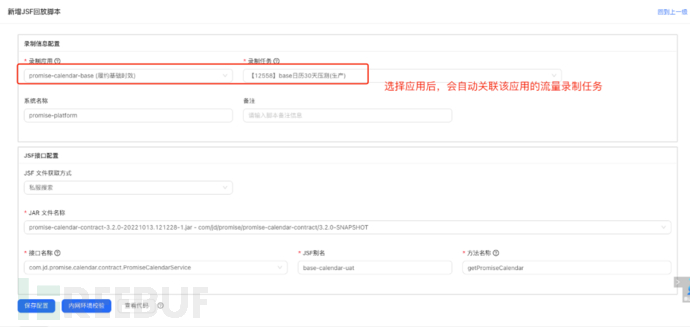
① Create a load testing traffic recording task: select the entry application, set the name and file size of the recording task, note: generally, when recording load testing traffic, it is recommended to record all scenario traffic as much as possible to ensure high fidelity of actual production traffic; when creating a recording task, it is recommended to record a file size not exceeding 2G;
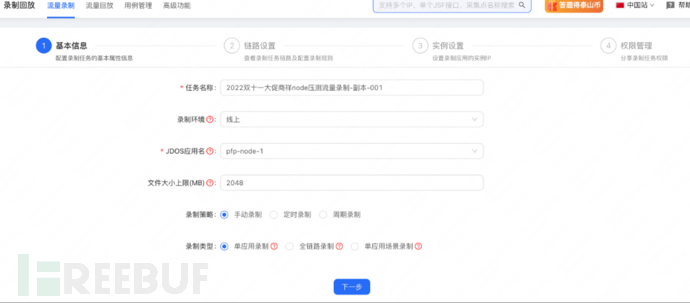
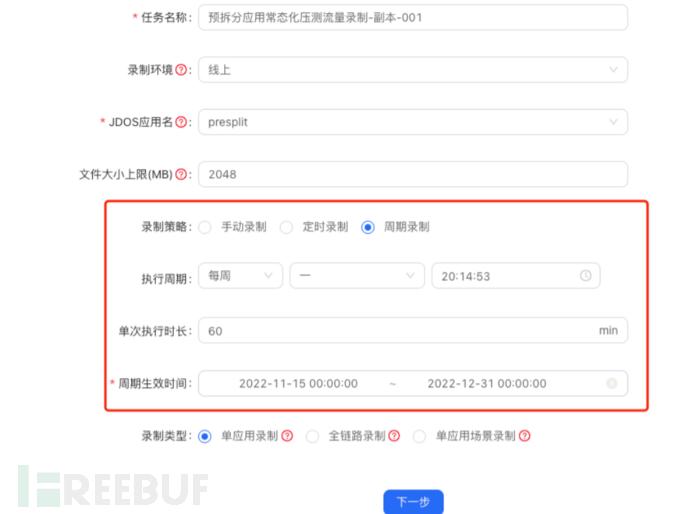
The traffic recording strategy includes manual recording, scheduled recording, and periodic recording. When performing regular load testing, to avoid the traffic being too old and deviating greatly from the current production traffic, you can create a periodic recording task of production traffic on the R2 platform, record the production traffic daily or weekly to ensure the timeliness of the load testing data.
② Select the starting service to be recorded, you can select multiple interfaces to record simultaneously, the platform will display the interface call chain, you can simultaneously start recording for services or middleware on the call chain, and then select the recording instance, set it, and then the task can start recording.
After the traffic recording is completed, you can create a load testing script on the forcebot load testing platform;
4.3 Load Testing Script Creation
4.3.1 Single Interface Load Testing Script
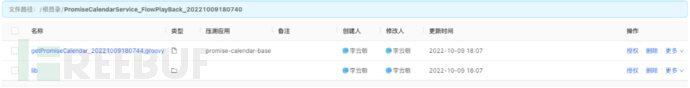
Create a JSF replay script in the script management, edit the recording information configuration, select the application to be load tested, the corresponding R2 recording traffic task, Forcebot supports searching for or manually uploading JSF files (jar packages) on the JD private service platform, the platform will automatically parse the classes and methods in the jar package, and call jsfOpenApi to obtain the interface alias and direct ipPort. By the above method, obtain the relevant information of the interface service, quickly build the jsf interface environment. After selecting the interface to be load tested, jsf alias, and load testing method, the load testing script will be automatically generated; the generated script is linked by default to the recording request in the selected R2 recording task, and can be directly used for load testing.
As shown in the figure below, you can perform an internal network environment verification, verify whether the script can normally obtain traffic and send actual requests to the corresponding interface, which is also a necessary step before stress testing. After the script is verified, save it, and the corresponding script and lib files will be automatically generated. If it is a single interface scenario stress test, you can use this script to create the stress test task here.
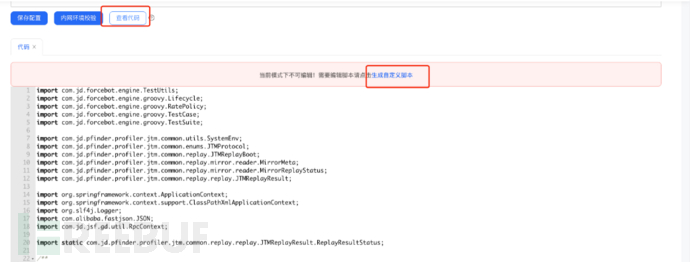
It is worth noting that the script generated in this way is not editable, and you need to create a custom script to edit it. Here, the page can only select one method of one interface. If you want to mix test different methods of the same interface or different interfaces, what should you do? Don't worry, the answer is on the way...
4.3.2 Multi-interface mixed stress test script
In actual production, our applications often provide multiple interfaces, or the same interface may provide different method services. When we stress test, if we only test based on a single interface, the stress test data can only reflect the performance of the system itself under a single transaction scenario. In actual production, especially during major promotions, the system often needs to handle multiple interface requests at the same time, and system resources are shared among multiple interfaces. Therefore, mixed scenario stress testing can better reflect the actual processing capability of the system.
Before conducting mixed stress testing, it is necessary to first clarify the call volume ratio of each interface scenario within the same time period. When creating the stress test script, the pressure request proportion 'rate' under each stress test scenario needs to be set according to this ratio.
Step 1: Generate standard JSF playback script
Before the custom script, first generate a standard JSF playback script as described in 3.3.1, and the dependent lib files will be automatically generated.
Step 2: Generate custom script
The default script generated in step 1 is not editable. You can generate a custom script by viewing the code, and then edit the custom script.
① First, define the interface path and method, corresponding to the alias of different interfaces, and then load traffic according to different interfaces.
The 'ipList' specifies the IP address and port of the server to be stressed and tested. If the interface alias is deployed in a cluster, and you only want to stress test one machine, you need to specify the IP address and port.
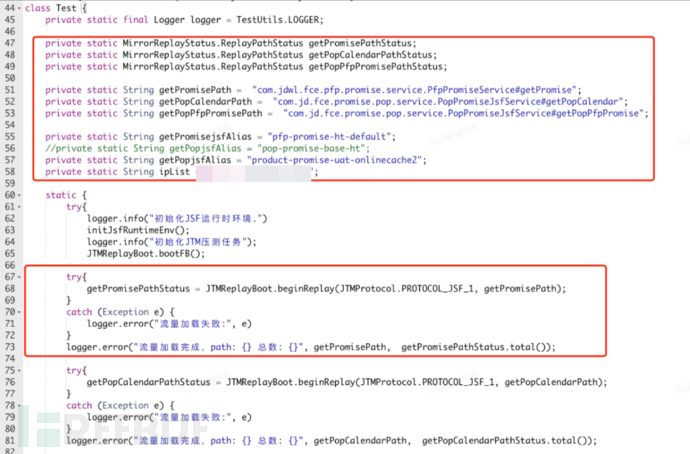
For different interfaces, playback transactions need to be created, and the interface path, traffic load, and alias of the interface must be corresponded one by one. 'rate' is the call volume ratio of multiple interfaces involved in this script, for example, interface 1:interface 2:interface 3 = 7:8:5 (for reference, the call volume ratio of each interface during peak periods such as major promotions or daily peak hours), then the corresponding pressure ratio needs to be set in the 'testCase'.
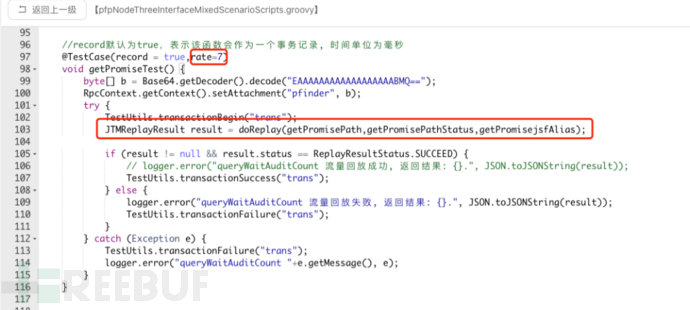
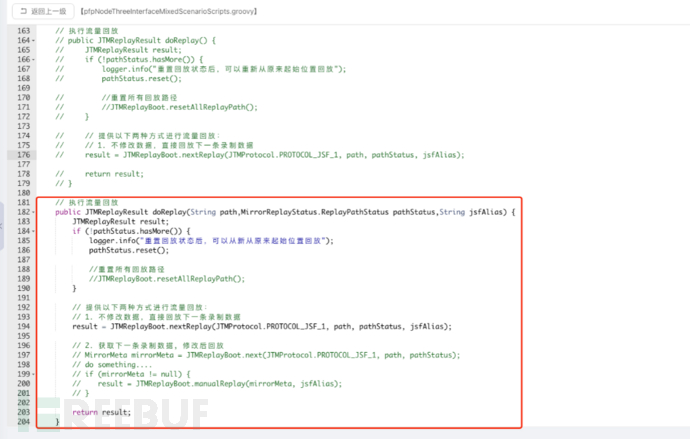
③ Because multiple interfaces involve different interface paths, traffic sources, and interface aliases, it is necessary to modify the default parameterless doReplay method to a parameter passing method.
④ Click save after the script is modified
⑤ The creation of mixed pressure testing scripts for the same interface but different methods is the same, the difference lies in that the alias of the same interface is consistent, and it is not necessary to specify other interface aliases again;
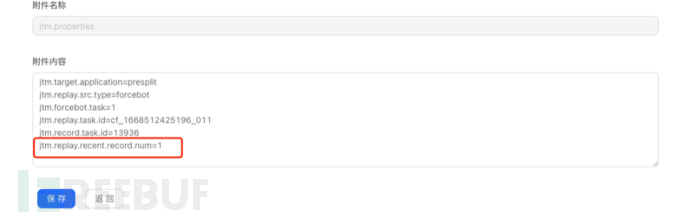
Step 3: Import attachment jtm.properties
After the custom script editing is completed in step 2, the execution still cannot be successful because the script is still missing the traffic recording playback attachment document. After saving the script, return to the upper-level directory, download the attachment jtm.properties generated in step 1 to the local, and then upload the attachment document to the custom script and modify the script attachment document. Add
jtm.replay.recent.record.num=1, specifying that the latest recorded traffic of the bound periodic traffic recording task is obtained each time the pressure testing is performed;
4.4 Practice of high-fidelity pressure testing during the Double Eleven major promotion
With the convenience provided by the R2 traffic recording platform, obtaining online traffic is no longer a difficult task, which can help us quickly complete the preparation of pressure testing data, and at the same time, the pressure testing traffic can restore the actual business scenario with high fidelity.
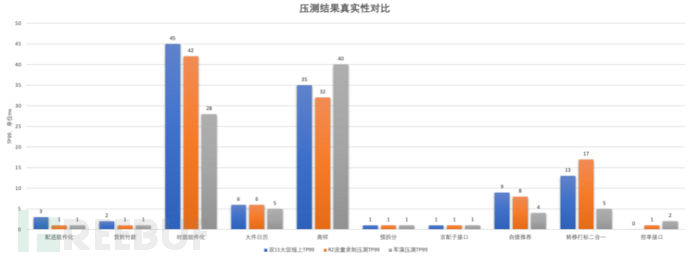
In this Double 11 major promotion, the logistics promise business line fully adopts the R2 traffic recording method for major promotion pressure testing, and the pressure testing results are closer to the online interface performance, with a truthfulness of over 90%; it provides more accurate data support for major promotion resource expansion evaluation. At the same time, through this high-fidelity pressure testing, we found multiple system performance issues, including the reduction of availability in extreme business scenarios.
The following figure shows the performance comparison of R2 traffic recording pressure testing, military exercise pressure testing, and the Double Eleven major promotion opening red.
5. Practice of USF常态化压测
Based on the常态化压测 capability of focebot, the USF core service with 3 stars is selected for常态化压测 practice, the TOP4 core interfaces are selected, the recorded online traffic of R2 is used, and the mixed scenario常态化压测 is carried out according to the traffic model of the major promotion, and the performance of the USF core interface is continuously monitored.
The 'forcbot'常态化压测工具支持 task reuse of pressure testing (supports traffic recording pressure testing tasks), configurable performance baseline including response time TP99 and the sum of TPS and server CPU resource indicators for performance baseline setting, and judgment of whether the pressure testing meets the standard according to the performance baseline, as well as the automatic creation of a Yun cloud defect for pressure testing results that do not meet the standard, for performance problem tracking and handling. In addition, it also provides pressure testing monitoring comparison data and historical records of pressure testing results, which is convenient for analyzing performance results and problems, and automatically sends pressure testing email notifications to synchronize performance pressure testing results in a timely manner.
Currently, the normalized load testing supported by forcebot includes the following functions:
・1, Supports the reuse of load testing tasks, can use historical load testing tasks, do not need to create load testing tasks and scripts separately, supports jsf, http, customized jimdb, jmq, and replay scripts.
・2, Can configure scheduled tasks for execution, flexible execution time.
・3, Can support traffic recording.
・4, Can automatically create Yundian defects
・5, Whether the configurable load testing meets the baseline (Effective: Whether to use the indicator for load testing pass rate statistics; checked will be as one of the indicators, not checked will not be counted as a statistical indicator in the pass rate calculation. Meet: When the effective indicator values meet at the same time, the load testing result is considered to meet the standard; otherwise, if any indicator value does not meet the conditions, the load testing does not meet the standard.
The following is a normalized load testing based on USF.
5.1 Preparation of Load Testing Materials
Load Testing Data:
・Choose the peak period of business from 14:00 to 16:00 to record 10% of the online traffic corresponding to 6 machines, record input parameters of 1G for 【Public Cluster】.(Subsequent consideration will be given to multiple clusters)
・The recorded interface service is one of the top 4 interfaces of USF3.0 online, has completed star governance, reached the three-star interface, completed governance of availability, TP99, and has downgrade and throttling plan governance.
Load Testing Scenario:Mixed Scenario Design (Model)
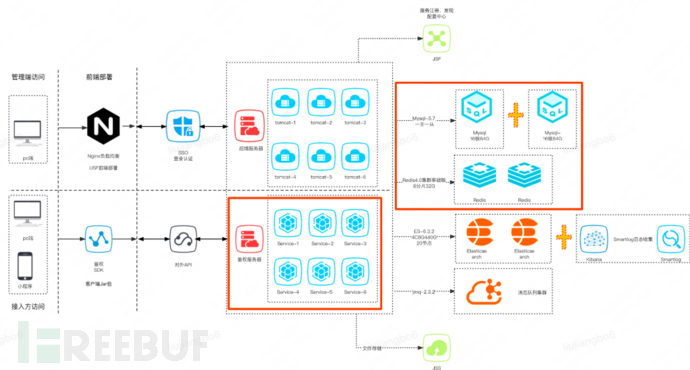
Application Deployment Topology Diagram:
Load Testing Environment:
The current load testing environment is the same configuration single-instance UAT environment as the online one.
・Consistent with the current online database and cache, and all have synchronized the online data.
・The configuration of the load testing environment database and the configuration of the cache service are consistent with the online ones.
1. Online Machine Configuration * Instance Count 60
2. Application Server Configuration: 4C8G
3. Database Configuration: 16C64G Memory
4. Load Testing Machine Configuration
5. Application Server Configuration: 4C8G
6. Database Configuration: 16C64G Memory
5.2 Load Testing Risk Assessment
・Load Testing Environment Selection:
・1) First carry out normalized load testing in the UAT environment with the same configuration, and continuously adjust the performance baseline according to the performance results.
・2) After stability, reuse the applications and middleware in the production environment for normalized load testing.
・Task Execution Window:
・Choose the off-peak period of business for load testing, combining the peak period of USF service monitored by ump, which is generally from 6-9, 9-11, and 14-17 in the morning, as the peak period of system usage.Therefore, the current time window for task execution is from 17:40 on weekdays. Currently, it is to handle alarm information in a timely manner, monitor the application and database situations.
・Synchronization of load testing links:
・Sort out the upstream and downstream links of load testing, determine the load testing scope, level, and time, and synchronize the consensus of relevant parties.
5.3 Creation of Normalized Load Testing Tasks
5.3.1 Criteria for Choosing Load Testing Template Tasks
・Reuse historical load test tasks (template tasks) to directly create regular load test tasks. When actually selecting historical load test task scenarios, it is recommended to choose according to the actual situation of the system, generally, it can be chosenPerformance turning point scenarios or scenarios where the expected value is reached(such as CPU60% or TPS meets the standard), it is generally recommended not to test the system resource saturation state.
・Example:For this USF, we choose historical load test tasks, which are scenarios where the interface meets the Double Eleven throughput TPS, at this time, the CPU pressure of the server is 27%, and the CPU of the database is 36%.
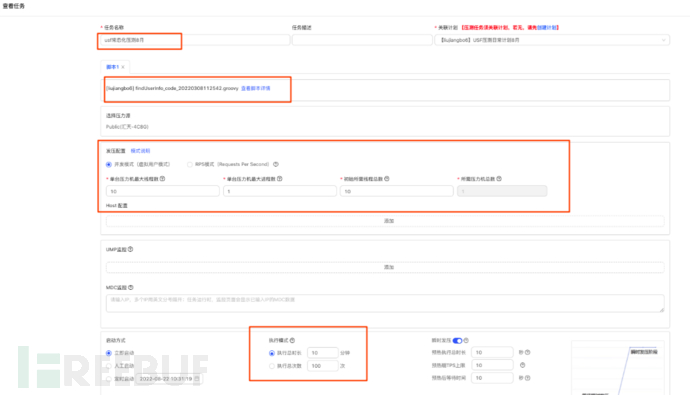
Template Task Selection:
View the task to see the script executed in this scenario, related settings for pressure, concurrent thread count, execution mode (concurrent mode and RPS mode), and execution time, which can be adjusted as needed.
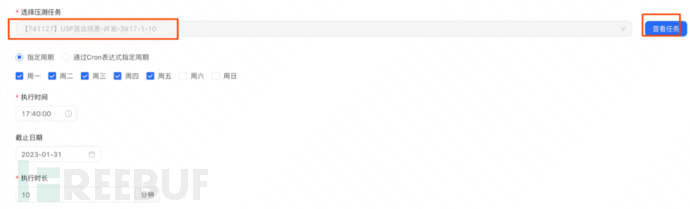
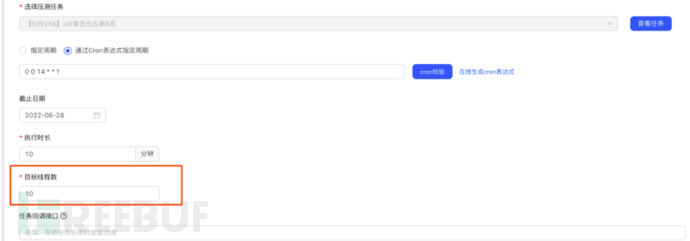
5.3.2 Load Test Scheduling Task Settings
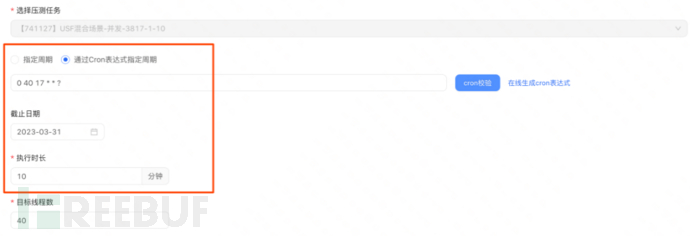
・The execution cycle can be specified by period or Cron expression, usf uses Cron here: 0 40 17 * * ? to execute at 5:40 PM every day. And set the target thread count and execution duration here. (This will override the thread count and execution duration in the load test task).
・The frequency and time of regular load test execution refer toCode deployment cycle and business call off-peak time periodComprehensive customization.
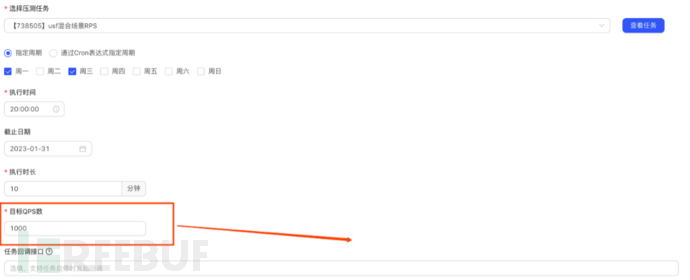
1) Execution Mode - RPS Mode
If the bound load test task is RPS, then the regular load test task we create is also in RPS mode. Set the target QPS,Not the sum of QPS of all interfaces in the scriptInstead ofThe load test target value corresponding to the interface with the largest proportion in the script, incorrect configuration may lead to excessive pressure.
2) Execution Mode - Concurrent Number Mode
If the bound load test task is a concurrent mode, then the regular load test task we create is also in concurrent execution mode. Set the target thread count.
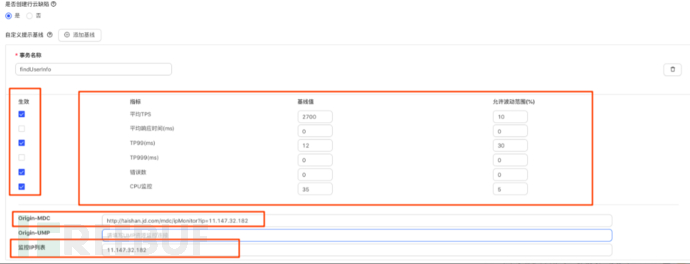
5.3.3 Load Test Baseline Settings
・According to the load test scenario corresponding to the load test task, set a reasonable load test baseline based on the transaction name (interface method).If the associated load test task is a mixed script, multiple interface transactions (transaction name defaults to: forcebot. Test method name) can be set step by step for the performance baseline of the load test.Generally, the indicators of average TPS, TP99, error count, and CPU monitoring are of concern. The allowable fluctuation range is given based on the actual situation of the interface. If it exceeds the set fluctuation range and the 'submit to cloud bug' option is selected, the bug will be automatically submitted to facilitate bug tracking and closure.
・Points to note when setting baseline indicators: If the baseline value is particularly low, the allowable fluctuation range percentage needs to be set relatively large, otherwise even slight fluctuations will be considered as failing the load test. The specific fluctuation range of the baseline should be analyzed case by case, with consensus reached between R&D and testing.
1) Custom Performance Baseline Settings
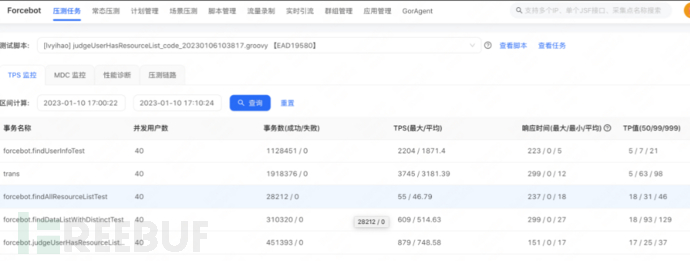
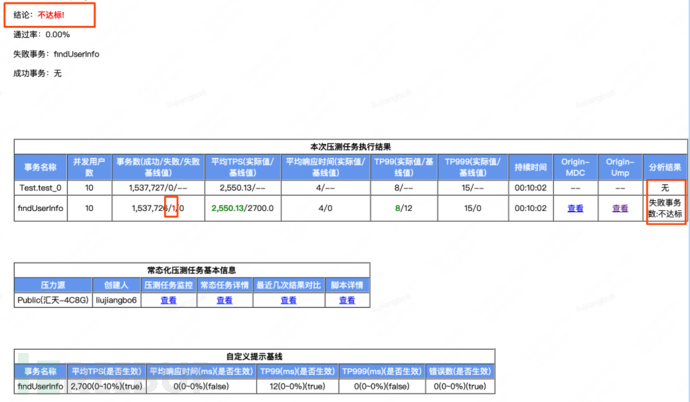
・Example of setting for USF's findUserInfo service:
・TPS baseline value = 2700, allowable fluctuation range 10% (2430-2970) floating up and down
・TP99 basic value = 12ms, allowable fluctuation range 50% (12ms-18ms) floating up, and time-related is upward floating
・Error count baseline value = 0, allowable fluctuation range 0.
・CPU monitoring baseline value = 25%, allowable fluctuation range = 20% (20%~30%) floating up and down
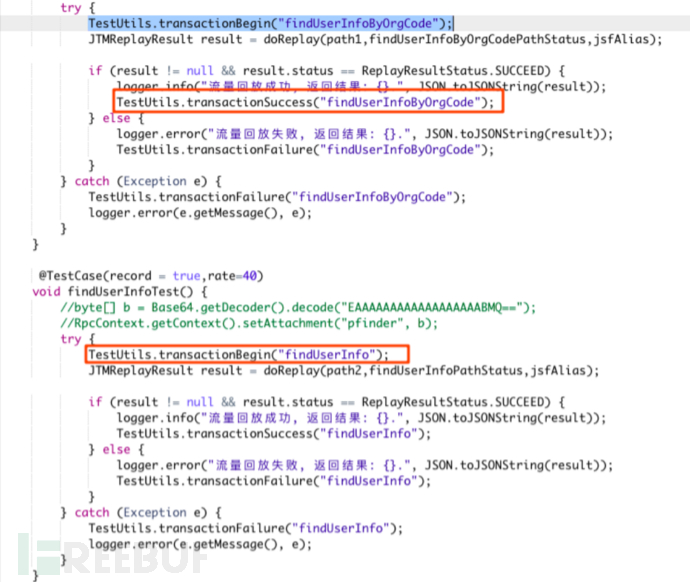
Transaction name:Currently, it cannot be automatically identified, and the default transaction name for the script can be written as forcebot. Test method name, which can also enhance the script by using a custom transaction name is
TestUtils.transactionBegin("findUserInfo"), that is, findUserInfo
Performance baseline settings examples: The interface performance tp99 is about 12ms at this time, and the baseline value is set to 12ms. If the allowable fluctuation range is set to 10%, the allowable fluctuation range is 12ms * 10% = 13.2ms. If it exceeds 13.2ms, it is considered to fail the pressure test, which is obviously unreasonable. At this time, the allowable fluctuation percentage needs to be set according to the maximum acceptable range of our interface tp99.
2) Multi-interface performance baseline settings
In the custom baseline settings, multiple interface transactions can be added, and this transaction is the transaction name in the script.
Default transaction name: forcebot. Test method name
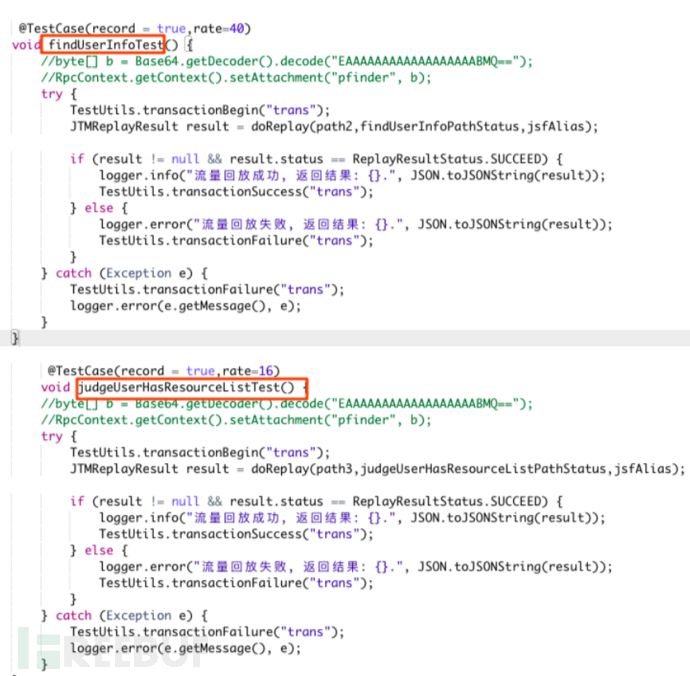
Custom transaction name:For example, TestUtils.transactionBegin("findUserInfoByOrgCode");
5.3.4 Tracking defects in the cloud
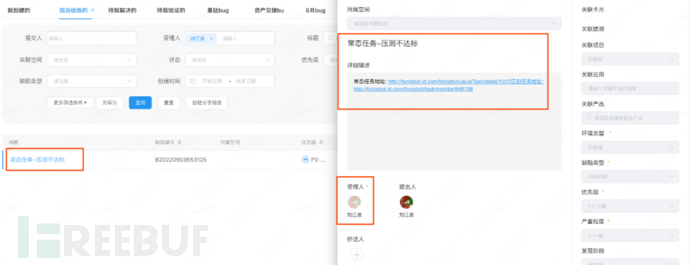
For indicators that do not meet the performance baseline settings, the regular pressure test results are considered to be failing. If the task configuration has enabled automatic creation of defects in the cloud, the results that do not meet the standard will be automatically submitted as defects in the cloud, which can ensure traceability of the bug life cycle stages and timely handling of problems.
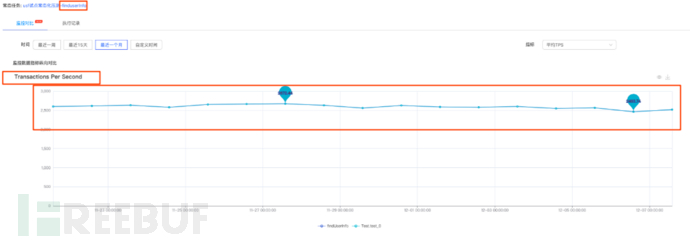
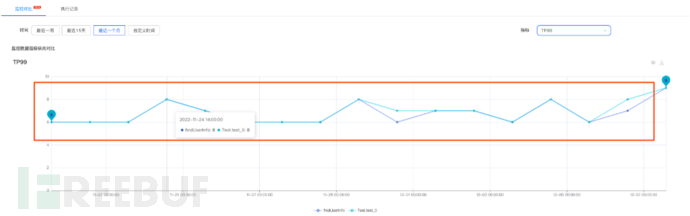
5.3.5 Monitoring and locating problems
You can view the performance trend of this service over a period of time. If the interface performance fluctuates greatly, it is necessary to further investigate the reasons for the decline in interface performance.
1) Monitoring data - TPS
2) Monitoring data - TP99
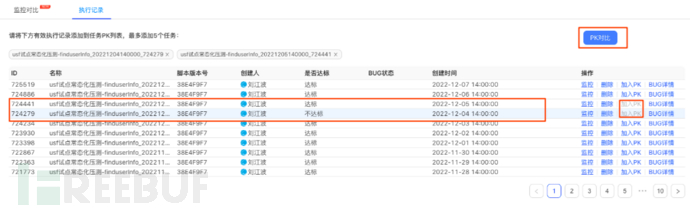
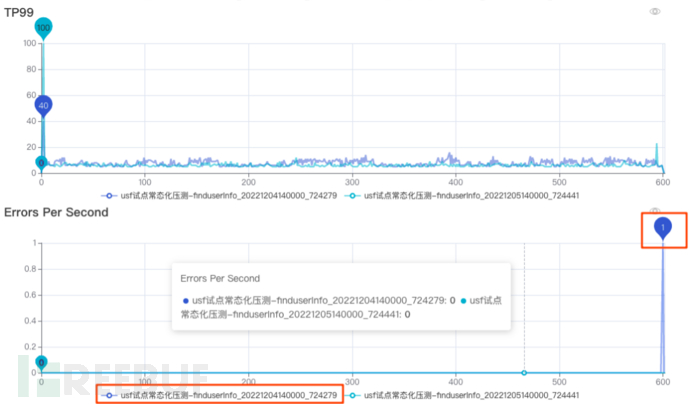
3) Detailed PK of execution record comparison
In the execution record, there are script versions, whether they meet the standards, and bug details. Select the pass and fail results for PK comparison, and the comparison items include TPS, TP99, Error Per Second, and other indicators.
The pressure test results of USF related interfaces, the PK between pass and fail are as follows: An error call occurred on 12-04, and the cause of the error needs to be further tracked.
5.3.6 Send performance test results by email
Set the recipient's email address, CC the relevant R&D and testing personnel, and the performance test results will provide a summary of the data display in the email. If any indicator in the performance test results does not meet the standard (exceeding the set value and fluctuation range), then this task is considered not to meet the standard. Combine monitoring information and logs during the execution period with R&D to locate the problem or adjust the performance baseline indicators.

The email is as follows:

评论已关闭