Series of articles
Build an information security visualization platform by yourself
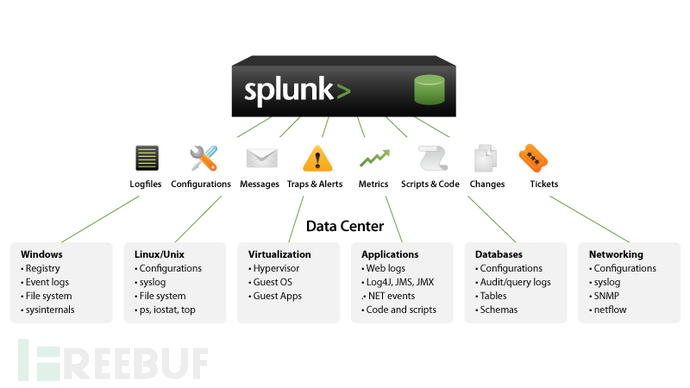
Continued article 1, Xiao Z introduced the most basic asset module, which has basically completed the simplest process from data input to visualization presentation. As shown in the figure below, Splunk supports almost all places that can generate data.

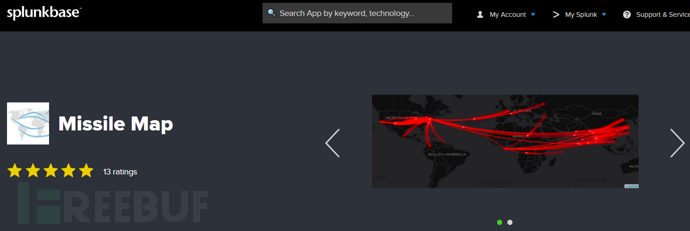
Subsequent articles will introduce several ways to connect to the platform and simple visualization effects and security scenarios, and this article introduces the construction process of Missle Map.
Syslog is supported by many devices, let's take this one for a test. As a visualization platform, Xiao Z thought ofhttps://www.fireeye.com/cyber-map/threat-map.htmlCan we try to implement a similar dynamic effect? This is slightly more complex than the asset module.
Scenario, server external connection
1. Scenario description: Servers allow external connections for various reasons, which is a big risk point for internal network security.
2. Data source: Exit load balancing syslog
3. App plugin:https://splunkbase.splunk.com/app/3511/
4. Configuration process: Parsing process
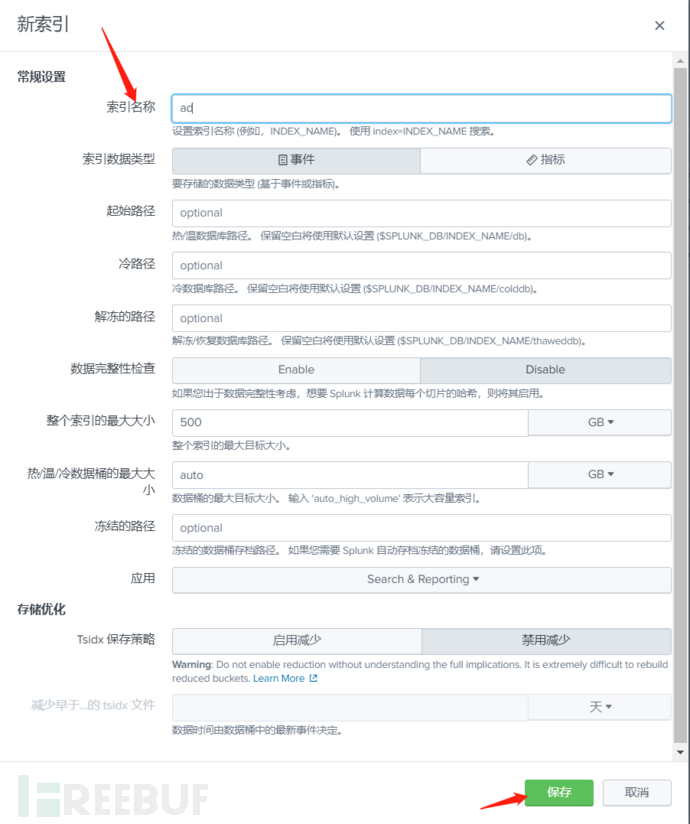
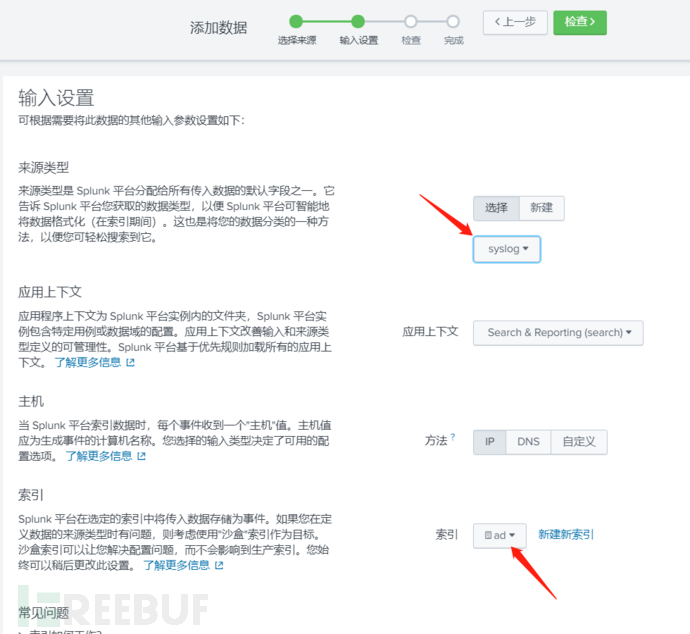
Create a new index: Settings - Index - Create Index - Enter the index name ad
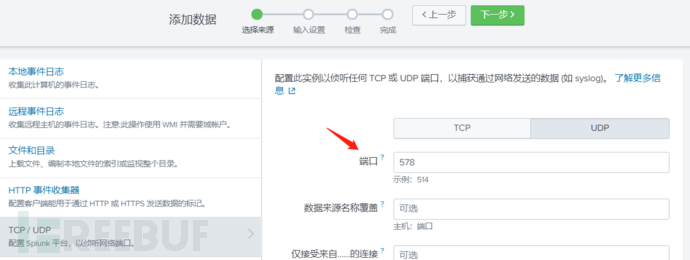
Configure syslog: Each device is more or less the same, configure the IP of the log server and the port number for log collection, here using UDP
Configure data input UDP new, here set the UDP port 578 as the port to receive syslog
Index selection: ad is used to receive syslog from the exit load balancer
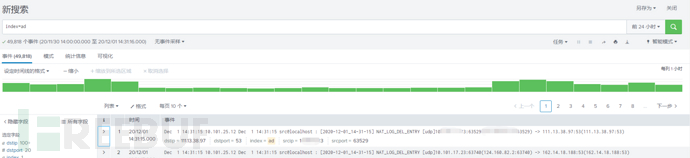
Search for the keyword filter with index=ad
After importing, the original data format is automatically filtered out to obtain the original data
How to present the data? Assuming that the missle map app has been installed, refer to the grammar rules of missle map
Grammar rules
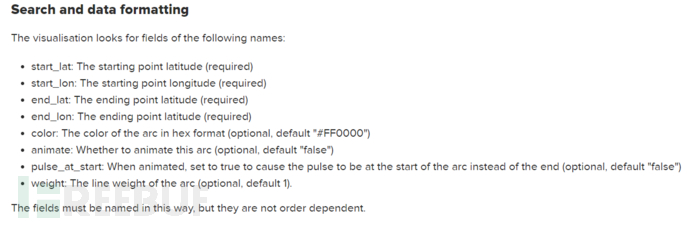
start_lat starts

评论已关闭