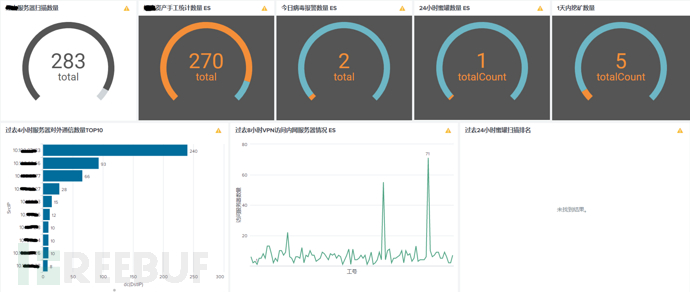
First, the platform homepage dashboard
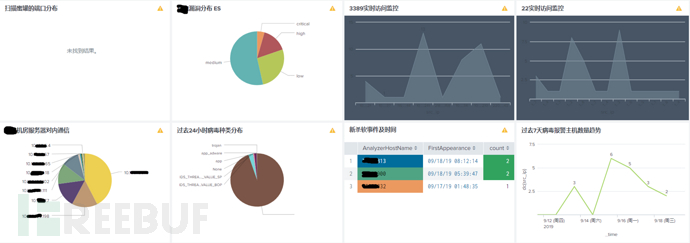
In the morning, Xiao Z opened the homepage dashboard of the self-built security visualization platform, observing everything happening in the internal network, looking for any events or IPs that needed to be investigated: the rocket chart showing the real-time external connections of several server groups at the top of the interface can tell which IP has made an external connection; there was an arp miss attack on the core switch, indicating that several hosts in the internal network had performed scanning actions, and the platform recorded the IP, time, and scanning times of the incident; the honeypot chart also found the latest attack port, IP, and other information; looking at the number of assets, it can be seen that the number of servers has increased by one compared to last week, indicating that the operation and maintenance team has built a server that has not been reported; the number of viruses today has increased by several compared to the previous day, and it was found that 3 terminals had virus alarms, and they were the latest discovered hosts, which needed to be handled to find out the cause of the infection, and there were also 4 mining hosts that needed to be investigated; looking at the VPN access chart, 2 hosts in the subsidiary accessed more servers than the normal threshold limit, whether it is necessary to notify the system administrator of the subsidiary to assist in investigating the cause, and which employee numbers have attempted to log in to VPN with errors; at the same time, some hosts accessed the key ports of the server, such as 3389 and 22, within the normal threshold range; for the vulnerability distribution, whether the high-risk vulnerabilities have decreased, this needs to be handled by the operation and maintenance team, etc. After sorting out all the problems, Xiao Z's work for the day began.


Second, the platform construction materials manual
Log Collection Tools
Currently, there are many tools for log collection, Xiao Z uses the log collection tool: Splunk trial version
Data Source
Currently, the data sources mainly come from the following ten major parts.
Excel asset list, antivirus background logs, vulnerability scan logs, some full traffic logs, intrusion prevention IPS, VPN access logs, honeypots, core switch logs, free online intelligence, internal system login logs, etc.;
Data input methods (different data sources use different log platform import methods), mainly the following 4 types:
1-Configure UDP or TCP ports, for example, syslog, etc.
2-Reading from background databases splunk db connect
https://splunkbase.splunk.com/app/2686/
3-Reading xls and other text files
4-API call to read
Data Storage
Splunk has the concept of Indexer, which provides data storage, indexing, similar to the role of Elasticsearch
https://docs.splunk.com/Documentation/Splunk/7.2.3/Indexer/Aboutindexesandindexers
Data processing and display
After the data comes in, it will mainly do some keyword filtering, statistical analysis, and visualization display processing.
Rules and visualization references
https://github.com/topics/threat-hunting
https://github.com/tianyulab/Threat_Hunting_with_ELK
https://www.threathunting.net/
https://www.splunk.com/en_us/products/premium-solutions/splunk-enterprise-security/features.html
3. Module Description
1. Asset management module
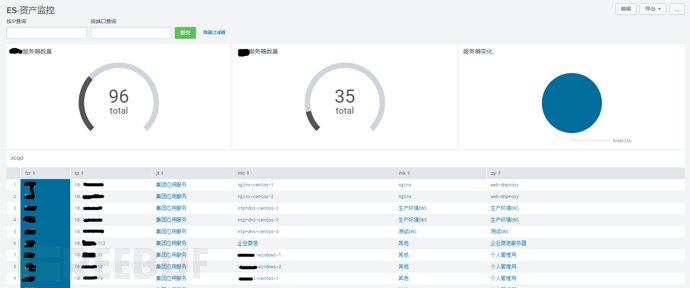
The object of information security management - informatized assets, how many servers, network devices, security devices, storage, etc. are there in the enterprise network, what applications have been run on these devices, what VLAN they belong to, which network security strategies have been enabled, and who is responsible for them, etc., must be clear at a glance. Because those forgotten corners are often the breakthrough points for hacker attacks, so this module is designed. It mainly consists of two parts of data input: one is the asset ledger of operation and maintenance management personnel, usually reading xls documents; the other is the weekly scan result statistics, which will be compared with the asset ledger to count the changes in the number of assets each week and find out the differences to ensure the real-time effectiveness of asset statistics. The asset module also has the one-click investigation function of server IP, which will be mentioned later.
2.Antivirus software logs
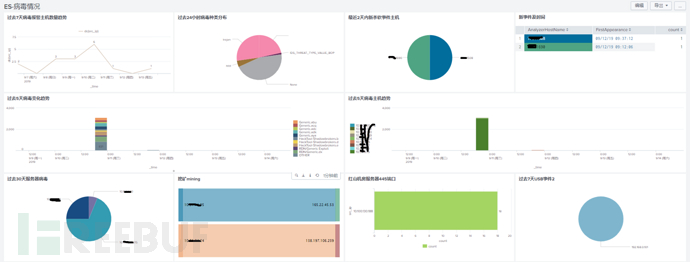
As an information security monitoring tool, antivirus software cannot be absent. This module focuses on the trend of the number of infected hosts in the past week, the distribution of virus types in the past 24 hours, the IP information of newly discovered infected hosts in the past 2 days, and the distribution of virus types and infected hosts in the past 5 days. From practical experience, the timeliness of the antivirus software's logs is very important. Of course, it does not mean that the timeliness of other logs is unimportant. This is a lesson learned by Xiao Z from the ransomware incident. At that time, the platform alarm was at the end of the workday, and the antivirus software reported the log of scanning and killing the ransomware tiger444.EXE, but no email or SMS alerts were made. Information was obtained in the first time, analyzed the hacker's attack intention, so missed the earliest opportunity to block, leading to the passive situation of the company the next day. The antivirus software's logs need to be cleared daily, which means that the same day's discovery is handled on the same day, the root cause of a single server or network interruption is investigated, and it is necessary to expand the investigation scope if possible.


评论已关闭