Preface
The previous eleven articles have come to an end, and some sub-items will be discussed陆续瞎白活. This article will start discussing Wazuh, including the system architecture, operating environment, and functional performance of version 4.2.6 and its components and modules, and will discuss them in two or three parts. Regarding the situation where open-source projects like this are modified into products domestically, I will describe my personal views.
Introduction to Wazuh
Overall architecture
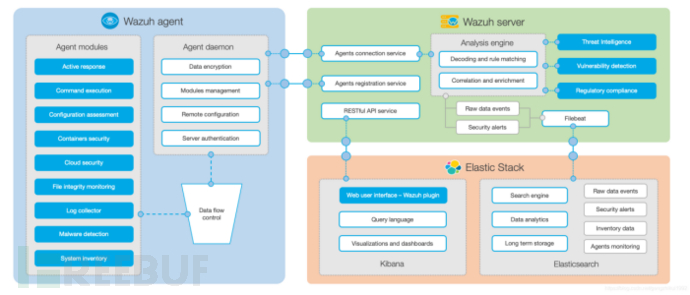
Wazuh is composed of endpoint agents and management servers. The endpoint agents collect information and execute commands on the endpoint servers according to the configuration items of the management server, monitor the security operation behaviors that occur in the endpoint system, and the management server analyzes the data collected by the agents. The decoder parses the data according to certain rules and matches it according to security rules to form security alerts. Wazuh includes three main components: Wazuh agent, Wazuh server, and Elastic Stack.
- Wazuh Agent: It is installed on the monitored endpoint. The compatibility of Wazuh is very good compared to domestic endpoint products.
- Wazuh Server: Collects and analyzes data returned by the agent, processes it according to certain rules after decoding, and uses threat intelligence to query known IOCs. A management server can support the analysis of data from thousands of agents, and can perform remote configuration and upgrades for agents.
- Elastic Stack: Indexes and stores alerts generated by the Wazuh server, and can manage Wazuh's configuration and monitor its running status. The integration of Wazuh and Kibana provides a powerful user interface for data visualization and analysis.

Product Composition
1. Agent
The Wazuh agent has a modular architecture, where different modules do not affect each other, execute the tasks received individually, and can start or disable agent modules through configuration. This Lego-like functional combination method is also adopted by most manufacturers.
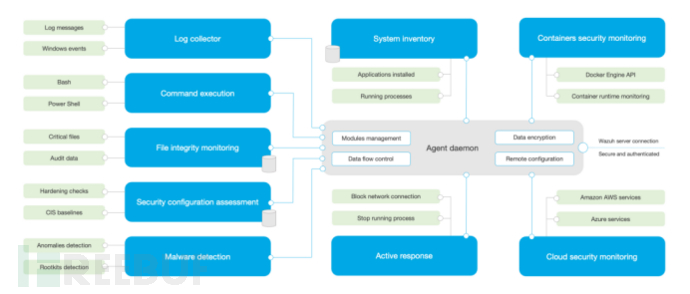
The main module functions of the proxy include: log collection, remote command execution monitoring, file integrity monitoring, security configuration compliance detection, malware detection, system information collection, container security detection, cloud security detection, and active response.
- Log Collection: Collects specified system logs, software logs, and Windows event information from the endpoint system, and can be configured to regularly execute and capture the results of specific command execution.
- Remote Command Execution Monitoring: Configured agents on the server regularly execute specific commands, collect command output results, and thereby determine the server's running status, such as monitoring the disk space usage of the proxy.
- File Integrity Monitoring: Monitors changes to the file system on the endpoint, sends reports to the server on attributes, size, deletion, or creation, and can capture real-time information such as which user, what time, and what operation behavior occurred when an event occurs.
- Security Configuration Compliance Detection: Collects security configuration items on the endpoint according to CIS rules and performs compliance checks on matches.
- Malware Detection: Based on an unsigned solution, detects anomalies and rootkits, monitors system calls, and searches for hidden processes, hidden files, and hidden ports.
- System Information Collection: This module runs at regular intervals, collecting and storing system versions, network configurations, running processes, installed software, and port lists on the endpoint.
- Container Security Detection: Monitors the content in the container environment, such as container images, network configurations, or data changes, and provides alerts for containers running in privileged mode and users executing commands in running containers.
- Cloud Security Detection: Monitors changes in cloud services and needs to be used in conjunction with its API to provide alerts for state changes in cloud service platforms.
- Active Response: When a threat is detected, it can block network connections, stop running processes, or malicious files.
Wazuh agents communicate with the Wazuh server to transmit collected data and security-related event information, the agent sends operational data, reports configuration and status, the Wazuh server can remotely upgrade and configure agents. Communication between Wazuh agents and the Wazuh server is conducted over a secure channel, encrypting and compressing data, queuing events when necessary, and protecting bandwidth. A unique secure key is formed between the agent and the server after registration, used for authentication and data encryption, preventing data theft and attacks.
2. Server
The Wazuh server is responsible for analyzing the data collected from agents and triggering alerts when events match, its main components include registration service, remote daemon service, analysis daemon, RESTful API.
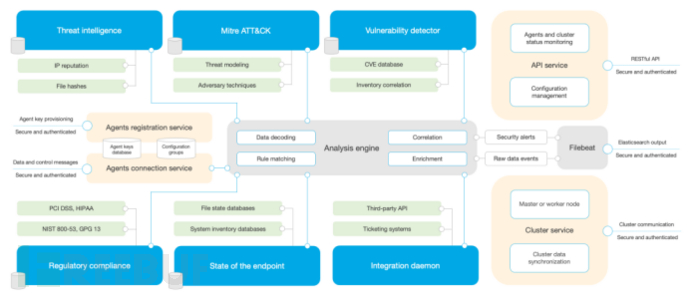
- Registration service: Registers new agents by providing and distributing each agent's unique pre-shared authentication key, supporting authentication through TLS/SSL or through a fixed password.
- Remote daemon service: Receives agent data, uses a pre-shared key to verify the identity of each agent, and encrypts communication between the agent and the manager.
- Analysis daemon: Performs data analysis, using decoders to identify the type of information being processed (such as Windows events, SSHD logs, web server logs, etc.), then extracts relevant data elements from log messages (such as source ip, event id, user, etc.), identifies specific patterns in the decoded log records using rules, which may trigger alerts and even may invoke automatic countermeasures (active response) such as: disabling IP on the firewall.
- RESTful API: Provides an interface for managing and monitoring the configuration and deployment status of agents.
3. Elastic stack
Elastic Stack is an open-source popular log management suite, including Elasticsearch, Logstash, Kibana, Filebeat, etc. Especially relevant to Wazuh are:
Elasticsearch: A highly scalable, full-text search and analysis engine. Elastic search is distributed, meaning that data (indexes) are divided into shards, and each shard can have zero or more replicas.
Logstash: A log collection and parsing tool for storing logs in a storage system (e.g., Elasticsearch). The collected events can also be enriched and transformed using input, filter, and output plugins.
Kibana: A flexible and intuitive web interface for mining, analyzing, and visualizing data. It runs on the content indexed on an Elasticsearch cluster.
Filebeat: A lightweight forwarder used to transmit logs in the network, usually used with Logstash or Elasticsearch.
Wazuh integrates with Elastic Stack, providing decoded log message feeds that will be indexed by Elasticsearch, as well as a real-time web console for alert and log data analysis. In addition, the Wazuh user interface can be used for managing and monitoring the Wazuh infrastructure.
An Elasticsearch index is a collection of documents with certain similar features. Wazuh uses up to three different indexes daily to store different types of events:
Wazuh-alerts: An index of alerts generated by the Wazuh server whenever an event triggers a rule.
wazuh-events: Index of all events (archived data) received from the agent, regardless of whether they trigger rules.
wazuh-monitoring: Index data related to the agent's status. The web interface uses it to represent the status of a single agent as 'active', 'disconnected', or 'never connected'.
An index consists of documents, where a document is a single alert, archived event, or status event. An Elasticsearch index is divided into one or more shards, and each shard can optionally have one or more replicas. Each primary and replica shard is a single Lucene index. Therefore, an Elasticsearch index is composed of many Lucene indexes. When a search runs on an Elasticsearch index, the search is executed in parallel on all shards, and the results are merged. Dividing an Elasticsearch index into multiple shards and replicas is used for multi-node elastic search clusters, the purpose of which is to narrow down search and achieve high availability. A single-node Elasticsearch cluster usually has only one shard per index, without any replicas.
4. Other
wazuh supports the analysis of third-party tools, such as the Bro intrusion detection program, by using Bro to enhance network intrusion detection at the endpoint, and form analysis reports for alerts.
Bro is a passive open-source traffic analyzer, mainly used for security monitoring of all deep suspicious behaviors on the link, providing a comprehensive platform for network traffic analysis. Install and configure Bro on the Wazuh agent machine, where the wazuh agent collects the network traffic monitoring logs of Bro, transmits the logs into the wazuh server according to the corresponding decoding rules for parsing, and forms network security alerts for the agent.
After installing Bro, add the collection of Bro logs to the agent's configuration file:
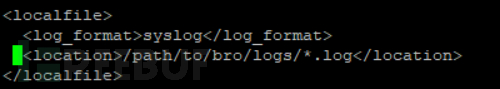
You need to add the corresponding Bro log parsing rules to the wazuh server configuration file /var/ossec/etc/rules/local-rules.xml to manage Bro's logs:
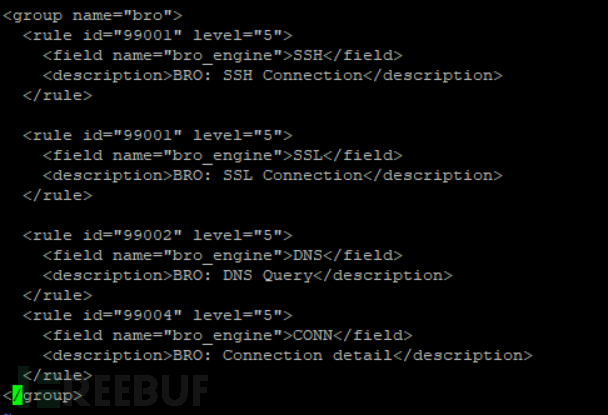
The wazuh agent collects network behavior log information formed by Bro and parses it into network alerts on the server.
Function, performance analysis
Running environment
Wazuh has good compatibility, the platform is suitable for various types of basic resources, the server can be deployed on physical machines, and can also be deployed on virtual machines, the server module supports unified deployment, and also supports independent module deployment. The specific runtime environment adaptability is as follows:
Operating system: supports Amazon Linux, CentOS, Debian, Fedora, OpenSUSE, Oracle Linux, RHEL, SUSE, Ubuntu, Raspbian OS (AIX, HP-UX, macOS, Solairs, Windows, MSU only supports proxy installation)
Minimum server configuration requirements: 4G 2U
Database: mainstream databases MySQL, MariaDB
JDK version: supports java 1.7 and above versions
Middleware: supports tomacat, nginx
Browser: Edge, Chrome, Firefox
Feature list
Wauzh server | Register service | |
Remote process guardian service | ||
Analysis daemon | ||
RESTful API | ||
Wazuh agent | Log collection | Syslog, audit, mysql... |
/var/log/*.log | ||
C:\Windows\app\log-%y-%m-%d.log | ||
Command execution | Execute authorized commands | |
Collect output results | ||
File integrity monitoring | Create, delete | |
Content change | ||
Security configuration configuration | Windows registry, policy | |
Linux key configuration files | ||
System information collection | System version, network information, running programs, installed software, ports, system patches | |
Malicious detection | System vulnerabilities | |
Malware | ||
Container security | Container resources, execution of privileged commands | |
Cloud service security | Cloud service status detection | |
Active response | Block network connections, stop malicious processes | |

评论已关闭