1. Preface
A typical enterprise will have a considerable number of open internet ports, which carry the applications published by the enterprise to the outside world and are the first line of defense in security protection. As a security operator, maintaining the boundary ports is a basic element.
Generally, enterprises will deploy traditional four-layer firewalls at the IDC boundary, which can block the vast majority of unnecessary ports open to the Internet. With most enterprises starting to cloud, on the cloud, it is more dependent on the 'security group' provided by cloud service providers to achieve port protection.

From the experience of actual operation, even if there are firewalls and cloud-based 'security groups' within the enterprise, there will still be abnormal open internal ports on the public network. This is more due to the lack of security awareness of developers and operators or poor configuration strategies. In large enterprises, the number of assets and personnel managing the assets increases, and uncontrollable factors increase. If the corresponding IT process management is not standardized and rigorous, it will lead to an uncontrollable number of ports opened to the outside world, for example, an accidentally started listening redis service on 0.0.0.0 by a configured public network IP host, or a misoperation of a firewall, may expose risks. Often when security personnel find high-risk ports open on the Internet, or reported by white hats of SRC, or even discovered after being attacked, the risk has become a real loss at this point.
For the low-level issue of port opening, some people believe that management methods are easier to solve this problem than technical methods, for example, by strictly managing processes, strict penalty measures to control this risk; personally, I think management methods are more dependent on the attention of the security department within the enterprise and the close cooperation with operation and maintenance and development. Without the above conditions, it is difficult to achieve the desired effect. From the perspective of security operation, the monitoring and perception ability of technical means is to examine the overall security risk from another angle, even if there are corresponding regulations to constrain it in security management, but technically, it is still necessary to do good monitoring to ensure that even if there are deviations in security management, risks can be discovered in time.
Under normal circumstances, the applications of normally open businesses will have relatively strict security restrictions, but services of abnormal businesses, or unexpected application port applications exposed on the public network, are a huge gap in the entire defense system. For attackers, finding a service with weak defenses or no defense measures at all is the easiest to break through, and also the most cost-effective; for the defense side, protecting service ports is also the most cost-effective and has the highest investment return ratio.
Therefore, it is very necessary at the technical level to dynamically monitor boundary ports to achieve real-time discovery of port open status, timely perception of boundary changes, timely制止port open high-risk behaviors, which can greatly reduce the risk exposure of enterprises and control risks within an acceptable range.
2. Asset Management
In some enterprises, it is often the case that asset management replaces port monitoring, which is actually two different security dimensions.
Firstly, asset management is not port monitoring. Ports are a continuous process of change, with a change frequency much higher than that of host assets. Asset management focuses on asset collection and is more concerned about the integrity and accuracy of enterprise internal asset information, so the frequency of asset scanning will be relatively low, and the timeliness will be relatively low.
In the offensive and defensive battle, 'information gap' and 'time gap' are two very important perspectives. As the defense side, it should strive to master the changes of boundary assets, fully utilize the unbalanced information of self-owned assets to counter the attacker's single-point breakthrough; if the defense side can discover exposed risks faster than the attacker, it will have more advantages and greater initiative. The low timeliness of asset management to discover ports may result in the loss of the initiative advantage.
In addition, port monitoring is also part of asset management. If port changes can be perceived in a timely manner, it can also improve the efficiency of asset management, especially the efficiency of boundary asset management. In the event of a 0day vulnerability outbreak, it can also respond quickly and timely sort out the exposure of risks.
Therefore, port monitoring should be a continuous security status monitoring, just like system administrators need to constantly pay attention to the CPU and memory usage of monitoring servers, security operation personnel must also constantly pay attention to the open status of boundary ports, and deal with risks in a timely manner.
3. Monitoring Strategy
Theoretically, each port is a risk, but in specific business scenarios and under specific security protection conditions, some risks are acceptable, while some port risks are not acceptable. Ports and risks can be simply classified as follows:
Risk ports: Publicly open ports, which may be required for normal business operations or may be non-compliant ports;
High-risk ports: Publicly open extremely dangerous ports, such as database ports, FTP ports, VNC ports, etc., these ports are not allowed;
High-risk services: High-risk services opened on non-standard ports, such as MySQL services opened on the non-standard port 3307;
Port monitoring refers to the monitoring of IP addresses and ports, where each IP address can have up to 65535 ports. To achieve timely perception of port changes, the simplest method is to continuously scan all ports for monitoring. The biggest problem here is that a large amount of host and network resources are required to meet the needs of this scanning action. For example, the most exaggerated approach is to apply for as many hosts as there are IP addresses, with each host scanning the 65535 ports of one IP address, scanning continuously and without interruption. Of course, this can achieve the monitoring effect, but it is impossible to appear in real-world situations.
So how can we ensure the fastest detection of changes in risk under limited resources?
In the actual operation process, the timeliness and coverage indicators are usually used to evaluate the monitoring system. Timeliness refers to the time it takes to perceive the change of the state, and the shorter the perception time, the better; coverage refers to the scope of the monitored assets, and the wider the scope of monitoring, the better. Under certain monitoring resources, it is difficult to satisfy both indicators at the same time. If in order to ensure timeliness, when monitoring, it is necessary to consider how to ensure the rapid completion of the scan, it is difficult to ensure a large and comprehensive coverage; similarly, if in order to ensure coverage, it is necessary to consider how to scan all ports as much as possible, this very time-consuming scanning task is difficult to ensure timeliness; just like in program development, the relationship between space and time, either use space to replace time, or use time to replace space.
Therefore, the monitoring targets for different risk levels of ports are naturally different.
The faster high-risk ports are discovered, the better, with the highest timeliness requirements and the secondary coverage requirements;
High-risk services should be discovered as soon as possible, with moderate timeliness requirements and moderate coverage requirements;
It is required to discover risk ports in a timely manner, with timeliness requirements being secondary and coverage requirements being the highest;
The reason for such classification is that, under normal circumstances, high-risk ports are services with high risks running on default ports, such as MySQL running on port 3306, Redis running on port 6379. These exposed default ports on the public network are constantly being scanned by various automated attack scripts. That is to say, once exposed to the public network, they are extremely easy to be discovered and attacked. As the defense side, it is necessary to discover and deal with them as soon as possible and properly. Therefore, the highest timeliness is required. Secondly, for high-risk services and risk ports, although the risks are high, the attackers also need to spend considerable cost resources to discover these risks. Therefore, for these two types, it is more important to be able to discover them in time. The details of timeliness and coverage will be elaborated in the following text.
3.1 Timeliness
The impact on timeliness indicators is mainly due to two variables: the number of monitoring targets and the complexity of monitoring.
1. The number of monitoring targets is composed of the number of monitored IPs and the number of monitored ports. It is evident that there are the following situations:
The number of IP assets is greater than the number of surviving IPs greater than the number of detectable IPs: the number of usable IP assets is greater than the actual number of IPs in use, and if there is a firewall, the number of hosts that can actually be detected will be even less;
The theoretical number of open ports is greater than the actual number of open ports: theoretically, each IP can open 65535 ports, but in a real environment, it is impossible to open all ports;
The number of actually open ports is greater than the number of high-risk ports: not every port is a high-risk port, only some need to be handled; but all open ports need to be audited to ensure they are secure.
2. Detection complexity The detection complexity is the degree of detailed detection required for the port, for example: the resource consumption of detecting the open status of port 80 on 10.0.0.1 and the resource consumption of detecting the service process information of port 80 on 10.0.0.1 are different. The latter obviously consumes more resources and takes longer.
A simple and rough representation can be given by the following formula:
Time consumption = Monitoring target number * Monitoring complexity / Available resources
Therefore, under the condition of a certain amount of available resources, to improve timeliness and reduce time consumption, it is necessary to reduce the number of monitoring targets or the complexity of monitoring;
3.2 Coverage
The coverage is mainly limited by the following conditions:
The accuracy of the asset list, for example, whether the IP data recorded in the CMDB is accurate and timely updated;
Whether the monitored ports cover the full range of ports, that is, ports 1 to 65535;
The accuracy of the fingerprint library of the monitored port services, which depends on the fingerprint library of the scanner;
Therefore, to improve the coverage, it is necessary to consider the above points. Of course, if the maximum coverage is required, it is the full IP full port scan.
3.3 Task Granularity
To do port monitoring and achieve the goals of timeliness and coverage, it is necessary to refine specific tasks, execute different tasks with different requirements at different stages, and finally combine different tasks reasonably to achieve feasible dynamic monitoring goals.
Therefore, according to the risk category, there can be several types of tasks with fine granularity:
| Serial number | Task name | Input | Task time consumption | Output | Description |
|---|---|---|---|---|---|
| 0 | IP living detection | IP assets | General | Living IPs | Discover living hosts from IP assets |
| 1 | Full port detection | Living IPs | Long | Open ports | Full port detection from living IPs |
| 2 | High-risk port detection | Living IPs | Short | High-risk ports | Only detect high-risk ports on living IPs |
| 3 | Port service detection | Open ports | Long | Port service | Only service detection on open ports |
| 4 | Port status monitoring | Open ports | General | Open ports | Continuously update the status of the discovered ports |
| 5 | High-risk backends | Open ports | General | High-risk backends | Discover high-risk backends from open ports |
| 6 | High-risk port detection of non-living IPs | Non-living IPs | Long | Open ports | High-risk port detection of non-living IPs, bottom-up strategy |
| 7 | Full port detection of non-living IPs | Non-living IPs | Very long | Open ports | Full port detection of non-living IPs, bottom-up strategy |
| 8 | Full asset full port detection | IP assets | Very long | Open ports | Full asset full port detection, bottom-up strategy |
3.4 Task Scheduling
The above is designed around the two indicators of timeliness and coverage, with the minimum task granularity, which is the minimum execution unit. Some tasks may not be the final result, but they provide input for the next task, which can minimize the scanning resources to ensure timeliness and improve efficiency. The scheduling between tasks can be represented by the following figure:
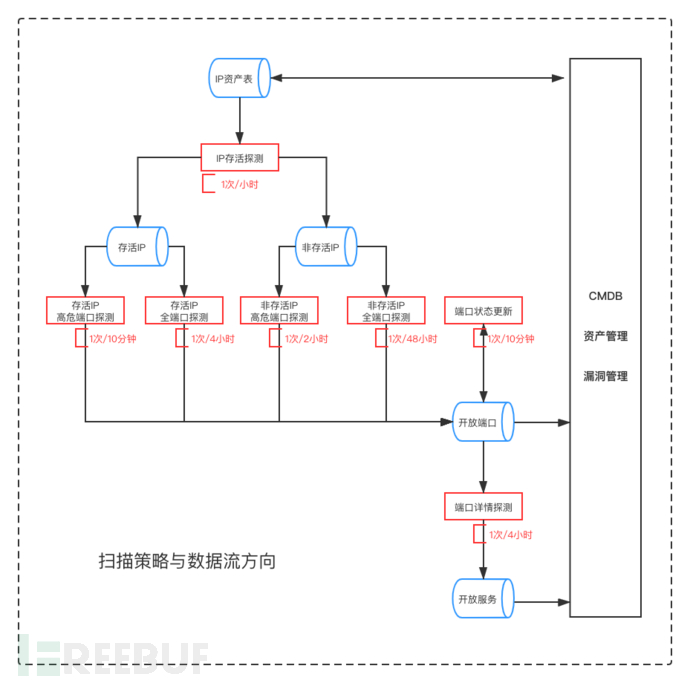
The scanning strategy shown in the figure above is just an example, and the scanning frequency can be adjusted according to the actual situation. As described in the figure, high-risk ports can be found within 10 minutes at the fastest, and in the worst case, they can be found within 2 hours.
After executing the established strategies, monitoring data dynamically flows between tasks, ensuring the timeliness requirements and meeting the coverage needs.
This design has several advantages.
Tasks are decoupled, and the failure of any task will not affect the timeliness of monitoring.
Tasks are the smallest granularity, and code implementation can reduce complexity and improve code robustness.
Task scheduling can be flexibly scheduled according to monitoring needs.
The entire monitoring data flow is visible, and any task result can be flexibly called.
3.5 Summary
Monitoring strategies require evaluating the security monitoring needs, analyzing the entire process of port monitoring and refining the tasks, analyzing the core objectives of each task, and combining them according to needs to achieve the goals of monitoring strategies globally.
4. Risk Closure
After executing the above strategies, it is possible to quickly discover ports, but the operation is not over, even it can be said that it has just truly begun, which is to close the risk loop in a timely manner.
In operation, there are two indicators called MTTD (Mean Time to Detection) and MTTR (Mean Time to Repair). The above strategies can reduce MTTD, but cannot solve MTTR.
To reduce MTTR, it is necessary to standardize and streamline all processes as much as possible, and then automate them through technical means, even engineering the entire system. This can be reflected in the following four points:
Asset Matching
Notification of Rectification
Report and Approval
Active Control
4.1 Asset Matching
For the risks discovered, the first thing is to be able to find out which system the risk point appears in, who the corresponding owner or operations person is, and be able to synchronize the risk information to them in a timely manner. This is to ensure that the scanned results can automatically and correctly find the corresponding asset information; but this is often very painful in the actual operation process, and the most important reason is that the CMDB information is inaccurate.
The accuracy of CMDB information seems to be a common problem for every company, which requires the collaboration of relevant IT departments such as systems, networks, and architecture to be improved. However, this is not an easy task. The result is that operation personnel are faced with a pile of risk ports but cannot find the person responsible for handling them.
If you want to avoid this problem as much as possible, one approach is to find as much information as possible about IT assets related to various business systems, workflows, or APIs or databases within the company. For example, if there is an internal IP that can never be found in the CMDB with the correct owner, you can try to retrieve this IP from databases such as the 'Server Resource Application Workflow'. If you're lucky, you can find the IP assigned during the initial resource initialization in the work order, and then you can find the corresponding owner. Similarly, there are many similar work orders or system records within the company that contain asset information. If these can be aggregated, the process of obtaining these data can be industrialized and standardized, and even a unified interface can be created for these data. This way, each time assets are matched, they can be matched through this interface, which can improve the accuracy and timeliness of asset matching.
In a word, asset matching may sound simple to talk about, but it is not an easy task, and it is closely related to the maturity and level of automation of the internal IT process.
4.2 Notification Alert
After obtaining the person responsible, notifications can be made, informing of the risks. For high-risk ports, they should even be upgraded to security incidents, at which point the corresponding notification alert capability is needed. In most cases, email, IM can be used, and some enterprises also have unified alert sending, so it is necessary to automate the alert interface to push alerts.
Port alerts can easily lead to broadcast storms. For example, a new IP without proper port control may start a batch of port services. Once the scanner detects them, all alerts will be pushed, which leads to the security operation personnel being busy dealing with alerts and easily淹没真正的风险告警. Therefore, before going online with alerts, some optimization needs to be done on the alert strategy. For example, aggregation can be done, where multiple alerts from the same IP with different ports are aggregated into one alert, or the interval between multiple alerts should not be less than a certain time window.
4.3 Active Control
The owner has been found, and the alert notification has been sent. What if it is not handled in time? Therefore, the security operation should have some active control permissions or capabilities. If the risk is relatively high and the owner cannot handle it in time, some mandatory measures can be taken. For example, temporarily closing the port through firewall rules or issuing a mandatory port closure command through an Agent. In addition, if the active control is automated, it is especially necessary to have a second confirmation at a node where someone needs to participate in a certain process. Because the active control capability is relatively easy to cause unintended harm, and if there is a bug in the automated program script, it can affect the business in a minute.
4.4 Reporting and Approval
The previous ones are all the handling after detection, and the best way is to do the necessary risk defense before detection. As mentioned before, open ports are risks, and since they are risks, they need to be assessed to ensure that the risks are within an acceptable range. Reporting and approval is the best assessment process.
This process requires the responsible person of the business party to be aware, and also requires the evaluation of the security operation personnel. Through the reporting and approval process, the business party can be clearly informed of the risks, handle the open business properly, clarify the security responsibilities, and also allow the security operation personnel to be aware of the risk level in advance and make necessary risk assessments.
After the reporting and approval process, the IP and port information needs to be synchronized to the database in a timely manner, which then becomes a whitelist. When an alert occurs, matching with the whitelist can also reduce the frequency and possibility of false alarms.
4.5 Convergence
When the monitoring system is just established, it may encounter some of the above problems to some extent, especially in the initial stage, it may be confused when scanning out a pile of unclaimed risk ports. As the process gradually improves and the level of automation increases, the reporting process becomes standardized, the number of risk ports in the wild will decrease, and eventually achieve the effect of convergence.
5. System Implementation
To meet the above monitoring strategies, the systems that can be seen on the market are either biased towards asset management or vulnerability scanning, and there is still no a very satisfactory product for dynamic and continuous monitoring. Therefore, it is only possible to reinvent the wheel.
5.1 System Requirements
Port monitoring operation is a dynamic and continuous monitoring and processing process, with the ability to dynamically update detection results. It is best to set the strategy and execute it automatically in the background, so that operation personnel only need to view the results directly, which also requires the system to have the ability to execute tasks on a schedule.
Secondly, the amount of IP assets involved at the boundary may be very large, and a single scanning node cannot meet the performance requirements for rapid detection. Additionally, different IP address segments may not be able to communicate with each other due to network isolation, which also requires the detection program to be distributed in different places. Therefore, it is necessary to decouple the program that executes scanning tasks and deploy it as a distributed node, to centrally distribute detection tasks in the background, process the results of detection tasks in the background, and then update the task results to the database in a predefined format.
Moreover, in the actual operation process, in addition to ensuring daily monitoring needs, it is also necessary to respond to certain special batch test scenarios; for example, a temporary online IP address segment needs to be quickly checked for high-risk ports; this requires the system to have certain scalability.
Finally, there should also be a visual interface, which does not have to be beautiful but must be functional. It should not be necessary to run a retrieval statement in the database every time to view the results.
In summary, the system design mainly considers the following aspects:
Supports scheduled task execution, considering scalability, and allows custom output parameters for dynamically executed tasks.
Scanning nodes support distributed deployment and unified management interfaces.
Task nodes are decoupled, supporting dynamic tasks, meeting the needs of batch task distribution, and also supporting single task distribution.
Modules directly support dynamic calls, improving the extensibility and flexibility of functions.
It has a visual interface with basic functions such as task configuration, result viewing, and quick search.
5.2 Framework Selection
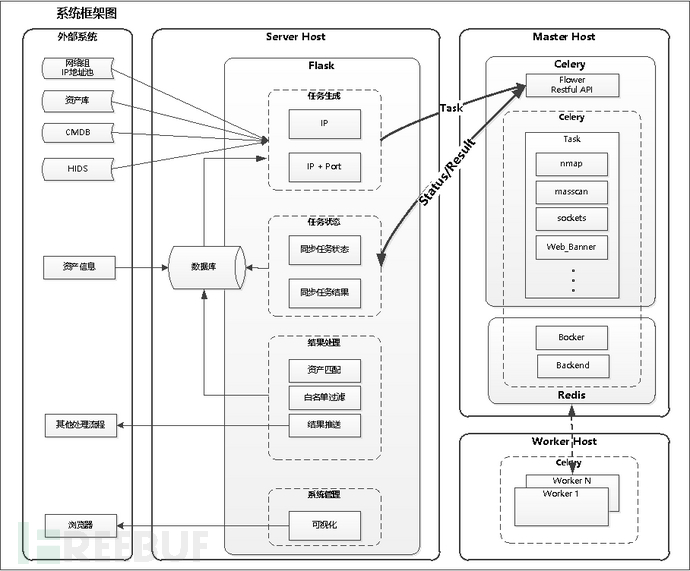
As a security operation personnel, Python is the best choice due to its simplicity, ease of understanding, rich third-party libraries, and quick learning curve; for the front-end, VueJs is relatively simple, and it's easy to create a few simple pages with the help of open-source frameworks; for the database, MongoDB is chosen, although the memory leak issue is not yet fully resolved, the SQL statements for CRUD operations are more convenient compared to MySQL, and the results are in JSON format, which is also well-suited for Python and JavaScript's VueJs, making it more convenient to use; for inter-module calls, since RPC is not well-versed, Restful is used instead, and the Flask framework is also powerful enough for such small projects.
Thus, the following list was created:
Database:
Mongodb: The main database of the system;
Background service:
Flask: A lightweight Web development framework in Python, providing basic Web functions;
flask-restful: A Restful API plugin for Flask, which realizes communication between the background API and nodes;
APScheduler: A Python task scheduling module that implements background task management and the function of scheduling tasks to nodes at regular intervals;
gunicorn: A Python WSGI service used to deploy Flask applications;
Supervisor: A background process management service used to ensure the continuous operation of background services;
Task Node:
Celery: A distributed task queue that implements node task execution;
Flower: A Celery component that implements Celery node monitoring and the Web API for task distribution and monitoring;
Redis: A Key-Value database, used for storing and scheduling Celery tasks;
Front-end framework:
vue-element-admin: A front-end development framework based on Vue and element, which realizes the visual display of the system;
5.3 Task Scheduling Design
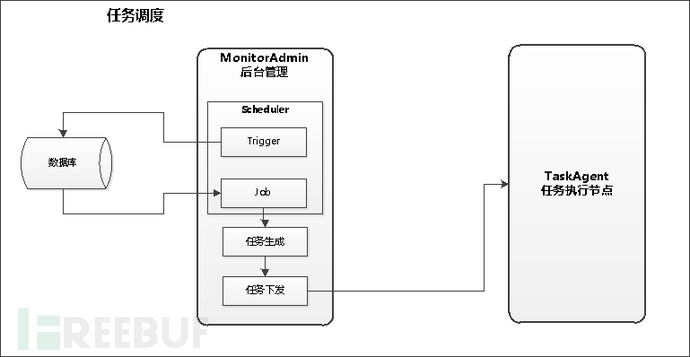
The core of the monitoring system is task scheduling, which is divided into two parts: distribution and execution;
Task distribution is sent to the corresponding node for execution in the system background according to the configured strategy. After the node executing the task receives the task, it executes the task and actively pushes the result to the target after the task is completed. At the same time, the background periodically refreshes the task execution status, tracks the task status, and stores it in the database after receiving the task to the result;
The console uses Apscheduler to execute scheduled tasks, mainly with the following parameters:
Trigger (Trigger): Configure timing parameters;
Task (Job): The main body of the task function to be executed at a scheduled time, as well as the parameters related to the task;
Scheduler (Scheduler): Trigger (Trigger) + Task (Job), simply put, it defines 'when and what task should be executed'.
The illustration is as follows:
5.4 Task Node
The task node is the Celery Worker that actually executes the task. The underlying scanning program can call snmp or masscan, where the former has rich scanning information but takes longer to scan, while the latter is not detailed enough but fast enough in scanning speed.
The task node Celey Worker receives the task, executes the corresponding task according to the task parameters, and after completing the task, the program executing the task returns the result in the form of an API to the control end. The control end performs normalization processing on the task result and stores it in the Mongodb database.
To facilitate data flow, predefined data tags are set up in the background. When issuing tasks, specify the corresponding tags to quickly issue task targets, which can reduce the complexity of operation and maintenance. Data source tags can be divided into the following several types:
IP_ASSETS: IP address resources, which can be IP segments or individual IP addresses;
IP_ONLINET: IP hosts that are alive, this data is generated after host detection;
IP_OFFLINE: IP hosts that are not alive, this data is generated after host detection;
PORT_OPEN: Ports opened during task execution;
PORT_DOWN: Ports closed during task execution;
5.5 System Demonstration
1. Monitoring Panel: It is still relatively simple at the moment, displaying basic information.
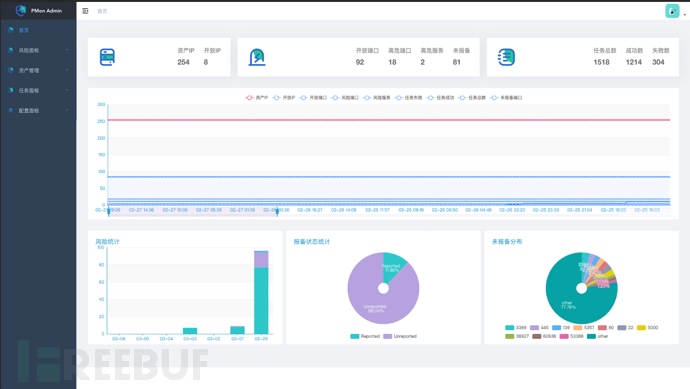
The monitoring panel mainly displays the number of discovered risks, risk categories, and task execution status;
2. Port Details: Display currently open ports
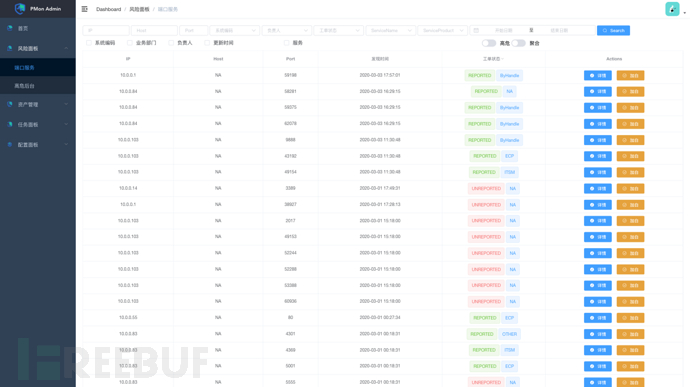
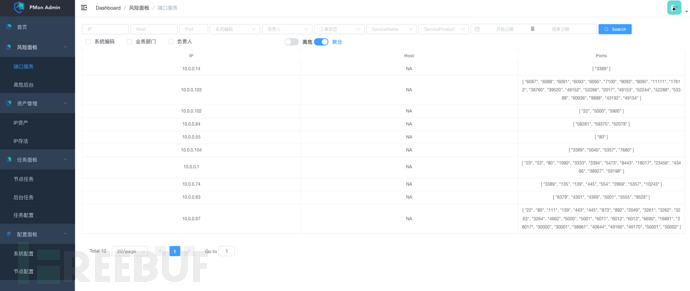
Port details should display all details as much as possible, including basic status, service information, asset information, and report information. It can also directly add whitelist operations. At the same time, the interface also needs to provide aggregation functions, which can view aggregated information according to IP. These functions are designed to make it easier for operation personnel to handle discovered risks more quickly;
Service Details:
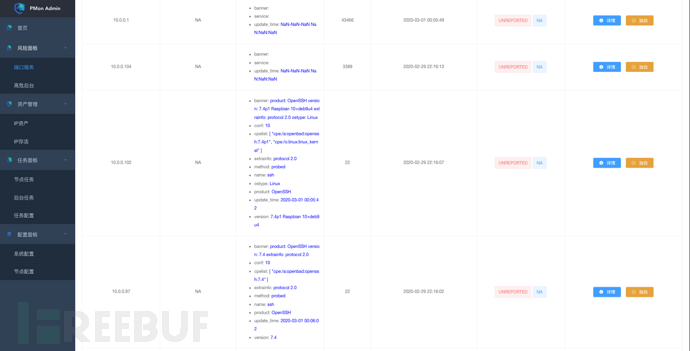
Aggregate Ports:
3. High-risk Background: Quickly find the risk background
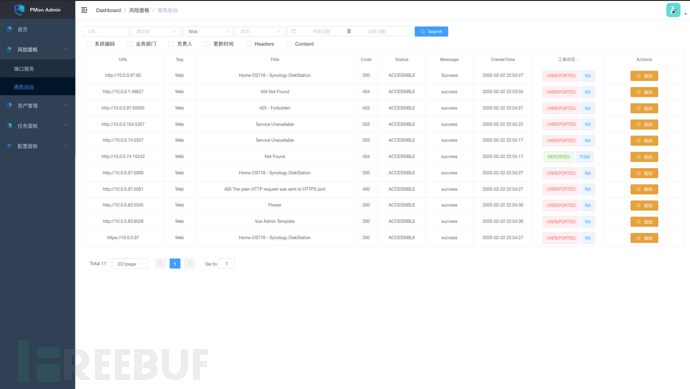
High-risk background is for discovering the backend management Web of components, these Web management backends have very high risks, but they are very easily overlooked risks;
4. IP Survival:

Check the survival status of IP assets, which is the simplest survival detection;
5. Task Status: Check the task execution status
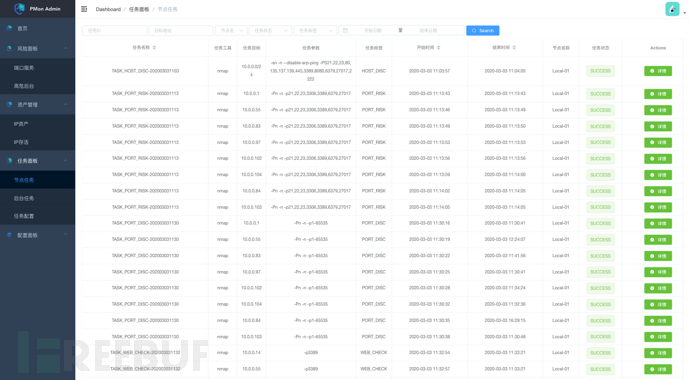
In the entire monitoring system, task status is an important item. It is necessary to ensure that all tasks are executed normally as much as possible. Only when tasks are normal can the monitoring results be normal;
6. Background Task: Check the task allocation status
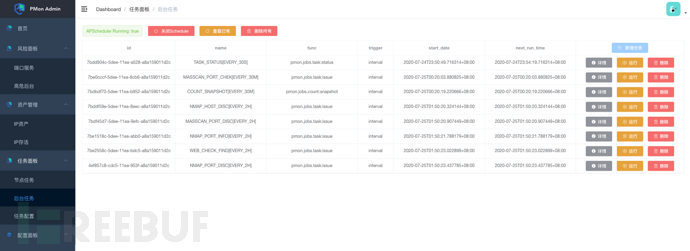
Check the task allocation status and adjust the task scheduling execution accordingly;
7. Task Configuration: Configure specific task parameters
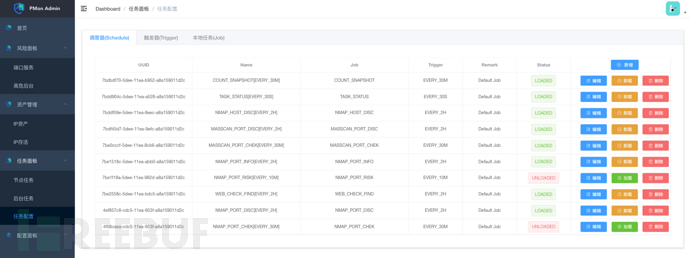
Configure specific task parameters on this page.
5.6 Code Implementation
The code is not attached to avoid embarrassment. If you are interested, you can follow the official WeChat account "An Xiaoji", reply "Port Monitoring" to get the GitHub address;
6. Postscript
Port monitoring, simply put, is scanning. It seems simple, but in fact, it is a big pitfall. To put it simply, there are the following points:
Port scanning is easy, but continuous monitoring is not easy;
It is easy to discover ports, but not easy to follow up on the process;
It is easy to discover risks, but not easy to close the risk loop;
It is because of these problems and the pitfalls we have stepped on that this article was written.
This is a small thought during port operation, welcome all the bigwigs to guide and guide.
评论已关闭