
Through it, you can define the structure of your data and generate code based on various languages. These data streams you define can be easily passed without destroying your existing programs. And you can also update these data without affecting the existing programs. It is worth mentioning that Protocol Buffers is often abbreviated as Protobuf.
Introduction to protobuf-inspector
protobuf-inspector is a powerful reverse engineering analysis tool that can help researchers perform reverse engineering analysis on Protocol Buffers. This tool can parse code blocks encoded with Google Protobuf (supporting v2 or v3) and can output beautifully formatted and colorful content for users. Below is an example of an output:
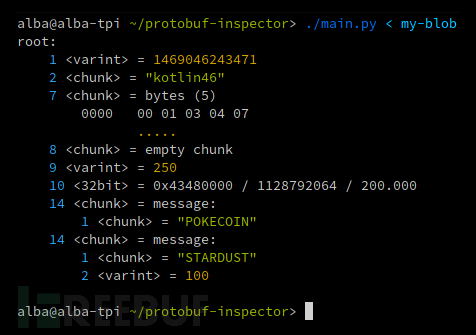
As we can see, the tool displays field names and some detailed data, including:
1. Whether variables are usedZig-zagEncoding(Assuming zig-zag encoding is not used by default);
2. Whether a 32-bit/64-bit value is an integer or a floating-point number (both are displayed by default);
3. Signature (automatically detected by default);
protobuf-inspector can correctly parse data structures in most cases. When it finds embedded binary data in a field, it will first try to parse it as a message. If it fails, it will display the data as a string or a hexadecimal dump.
It follows the field order inWire FormatIt displays the encoding order of fields, so it is also very useful for those who want to be familiar with the wire format or parser developers, in addition to reverse engineering.
Tool Download
As this tool is developed based on Python, we first need to install and configure the Python environment on our local device. Next, researchers can use the following commands to clone the tool's source code to their local machine:
git clone https://github.com/mildsunrise/protobuf-inspector.git
In addition, we can also use pip to install protobuf-inspector:
pip install protobuf-inspector
Tool usage
After the tool is installed, we can use the following command to provide Protobuf data to the tool through STDIN:
protobuf_inspector < my-protobuf-blob
Using as a code library
from protobuf_inspector.types import StandardParser


parser = StandardParser()

with open('my-blob', 'rb') as fh:

output = parser.parse_message(fh, "message")

print(output)
This tool also allows us to integrate into other code as a third-party code library, for specific usage, please refer to protobuf_inspector/__main__.py.
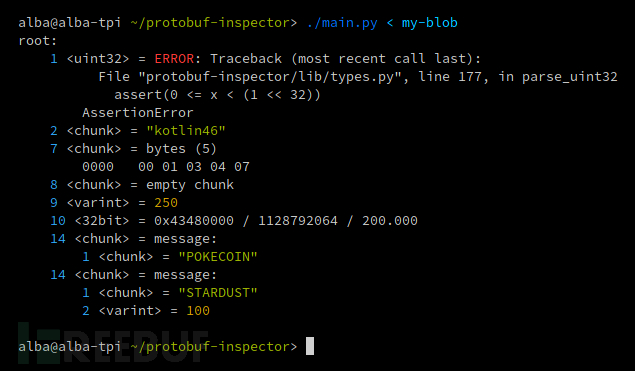
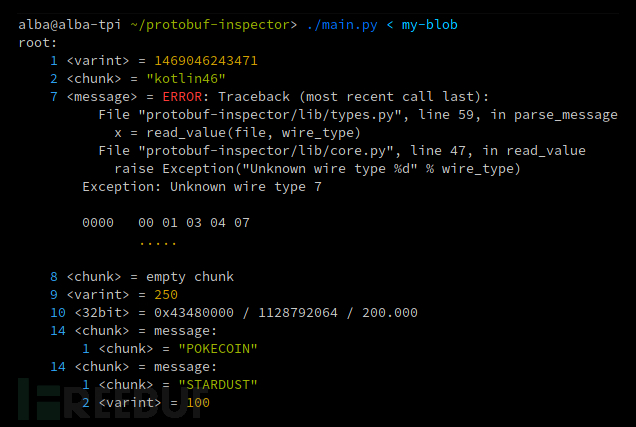
Parsing error
If you encounter parsing error issues, parsing will terminate at a specific field, but it will not be affected outside the hierarchy. The stack trace will be printed to the location of the field content, and if applicable, a hexdump will also be printed indicating the location where parsing stopped in the block.
If you specify uint32 and find a larger variable, you will get the following result:
If you specify a field containing an embedded message but find invalid data in it, you will get:
Please note that if one or more analysis errors occur, main.py will exit with a non-zero status.
License Agreement
The development and release of this project followISCOpen Source License Agreement.
Project address
protobuf-inspector:【GitHub Gateway】
Reference materials
https://developers.google.com/protocol-buffers/docs/encoding#signed-integers
https://developers.google.com/protocol-buffers
https://developers.google.com/protocol-buffers/docs/encoding

评论已关闭