Online social networks (OSN) are popular applications for sharing various data (including text, photos, and videos). However, the issue of fake accounts is one of the obstacles facing the current OSN system. Attackers use fake accounts to distribute misleading information, such as malware, viruses, or malicious URLs. Inspired by the huge success of computer vision and deep learning, this study proposes DeepProfile, a deep neural network (DNN) algorithm to handle fake social account issues, and constructs a dynamic CNN to train a learning model for fake profile classification. This paper proposes a new pooling layer to optimize the performance of the neural network during the training process. Experimental results show that promising results with better accuracy and smaller loss than ordinary learning algorithms are obtained in the task of malicious account classification.
0x01 Introduction
Online social networks (OSN, Online Social Network) are currently an indispensable element in daily life. It has become a popular application for connecting people from all over the world to share various data, including videos, photos, and messages. However, abnormal issues such as fake accounts have become an important problem in OSN protection. Some studies have proposed technologies to improve OSN protection in various ways. For example, virtual channel models, etc.

Generally, each device has security mechanisms for unlocking and accessing the device, such as PIN, password, and gesture password. Unfortunately, traditional models put user data at risk because there are no additional security measures to check user activities and performance after unlocking or logging into an application. Based on these vulnerabilities, unauthorized persons may be able to crack simple passwords or PINs on mobile phones or wearable devices.
In the era of continuous development of Internet technology, the number of OSN (Online Social Network) users is increasing sharply, and network data is undergoing massive changes. On the privacy issues of OSN, many researchers have proposed various anonymous detection methods, but these methods ignore some differences in individual privacy protection needs. Abnormal accounts have become one of the main challenges facing the current public OSN. The growing number of users on OSN has increased the probability level of malicious activities, which is a huge challenge for OSN with a large number of users and a dynamic environment.
The issue of monitoring abnormal accounts has become a headache for OSN providers, as infected users can spread false or deceptive information to target users. A large number of OSNs have become the main targets for exploiting fake accounts in witch attacks (Sybil Attacks). Humans or robots can create fake accounts with similar features and characteristics to personal profiles. For example, personal accounts and bot accounts share the same identity in terms of names or images. Intruders can exploit this flaw to monitor targets. For example, in Telegram, intruders can reconstruct the data logs sent or received by users. Due to the vulnerability of OSN, suspicious nodes may pose a Sybil threat. Generally, abnormal issues are composed of different types of threats, such as vertical attacks on OSN providers or horizontal attacks on OSN members. From the perspective of the server, fake accounts can impersonate OSN users and post misleading information on their profiles. One of the main challenges is how to identify fake profiles in a large amount of different content, including text and multimedia.
The defects in link recommendation technology enable malicious nodes to deceive, collaborate in deception, and maliciously recommend other nodes for greater gains. Due to the lack of effective incentive strategies, many nodes neither evaluate nor recommend. Current research uses machine learning methods as a new approach to predicting OSN attacks. In the implementation of the learning model for abnormal classification, various OSN attributes are used as training features for the users to train the learning model. OSN attributes are collected from many users connected to the server. The following figure illustrates communication between users in the OSN environment.
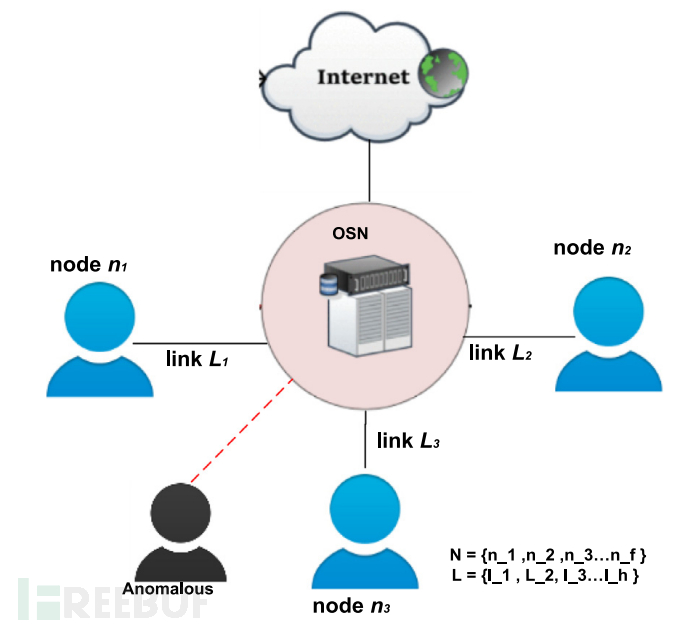
Generally, an OSN consists of a set of limited users (nodes) and relationships (links). This experiment constructs an OSN graph by providing nodes (n) and the connections between nodes (l). Many nodes in the OSN are represented by N, where N = {n1, n2, n3…nf}, and a set of connections represented by L, where L = {l1, l2, l3…lh}. Participants are individuals, groups, organizations, computers, or other entities involved in information and knowledge processing. To establish interactions among members, the system introduces social relationships or user identity links. User profiles contain many personal details, such as usernames, full names, phone numbers, etc. The drawbacks of privacy protection allow sophisticated attackers to manipulate or disrupt critical content. They can use social engineering techniques and forged profiles to steal information and manipulate data. Fake profile attacks threaten the reputation of enterprises or organizations and are confused with abnormal and unnecessary updates.
0x02 Background
User profiles can represent the historical information of user activities in the OSN environment and are used to capture the expected behavior of ordinary users. To collect user profiles, this experiment focuses on the information flow posted on the wall. Then, other useful features, such as profile pictures or social activities (such as connecting friends or follower relationships), are collected. The OSN system usually does not provide historical data changes.
This experiment constructs the user profile U in the following way: first, investigate the user flow information U obtained from the online database corpus. The stream includes the data stream of OSN users arranged in a hierarchical order. The OSN dataset with message streams is collected in a slightly different way. The stream describes his/her wall information, which also contains user messages posted on other friends' walls.
In the initial stage, data is collected from OSN information and used to build extracted features. These models capture the characteristics of OSN users, such as usernames, email addresses, message streams, location, or the mother tongue used for communication between users. In summary, the model acquires data, extracts several features, and uses learning models to train these features. In the final stage, the extracted features are calculated, and the account is determined to be fake or benign by analyzing the existing profiles.
A. Problem Definition
In OSN, individuals or organizations are represented by a node. OSN consists of many participants communicating in the OSN system. The OSN community has nodes and the relationship between two nodes, which represent the data exchange used to obtain local and global network hierarchy. DeepProfile has two definitions as the following features to build the model.
Definition 1 (Social Network):
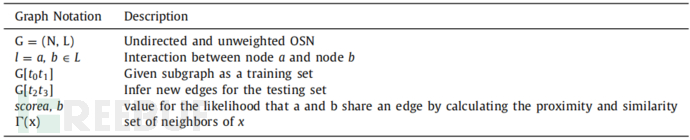
The formal representation of the OSN graph is G=(N,L), where the parameter N={n1,n2,n3…nn} represents the nodes (vertices) in the graph, and the parameter LL = {l1,l2,l3…ln} represents the links (edges) in the set. The link set L⊂N × N represents the relationship between nodes. The vertex set is represented as an undirected graph. Since it is an undirected network, there is no distinction between the edge from node a to b and the edge from b to a. The following table shows the elements in the graph:
In the OSN architecture, research can adopt a graph with the following specific components:
(1) P reflects the adjacency matrix of the graph G. If (a, b) is a node in the graph G, then P(a, b) = 1 or P(a, b) = 0.
(2) Graph of Friend, i.e., GF represents the graph G and the node a ∈ G.N, which represents the vertex containing all directly connected vertices.
(3) Total Friend, i.e., TF(a, b) = |GF(a).N∪GF(b)N| represents the number of different friends between two nodes a and b.
Generally, in classification problems, a study constructs supervised learning to handle malicious account detection. In this process, a training interval ([t0, t’0]) and a test interval ([t1, t‘1]) are constructed.
Definition 2 (Attributes of social networks):
Public OSN adopts an unweighted undirected graph G = (N, L) to represent the topological structure of social networks. In this experiment, Ai ∈ R^(NxN) is represented as an adjacency matrix. Given a network with social network information graph G, OSN has link state Ai ∈ R^(NxN) and historical network G^h = {G^(t - N), ..., G^(t - 1)}.
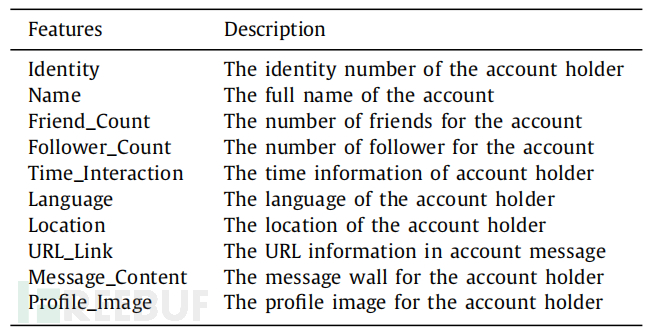
OSN consists of several attributes, such as user identity Pu and relationship Ru. User identity Pu refers to the real natural member, which is the personal account in OSN, represented by the user, including username, age, and other attributes. Ru represents the social relationship of the user in OSN, including nodes and edges. The explicit attributes of OSN are defined as P, where P = {p1, p2, …, pn} is the set of user identities in the OSN system. This research provides advanced attributes as input features to train model classifiers as shown below:
(1) Account identity
These features include user identity, which includes username, full name of the active account. Public OSN usually provides regular Web and mobile Web to its members, and most OSN applications running on mobile platforms operate under iOS and Android OS. These features represent the key part of the user profile. The compatibility of full name and avatar indicates that each account can be categorized as normal or suspicious account. Whenever a username or full name in the application changes, it may indicate that an intruder has compromised the account to provide access to suspicious applications.
(2) Number of followers and friends
The OSN service provides a way for users to interact with each other directly by sending direct messages to the recipient's address. OSN applications may count how many users or friends are in a certain circle, and there are various methods to calculate and monitor this. For example, on Facebook, you can directly view the number of friends from the profile; on Instagram, you can check the number of followers of other users by simply clicking on the link of friends. Each specific user establishes personal interactions with other users each time. Therefore, the interactions between linked users can be mapped to a pattern. It tracks accounts to interact with familiar legitimate accounts. However, abnormal followers may spread direct messages to attract the attention of the recipient. Spammers often do this to test the public's response before luring victims.
(3) Time Interaction
The DeepProfile model captures the time spent using OSN services. The time when users are frequently active during the day. Many users have specific time periods during the day when they are more likely to send messages or post on their walls, such as during lunch breaks or quiet periods (sleep time). Generally, OSN users interact on the platform from rest times (lunch or dinner times) to before midnight, before the normal sleep time. In many cases, if the account flow indicates regular use during sleep time, the user will be classified as a quiet period activity and considered suspicious.
(4) Location
Generally, OSN users interact with other users who are geographically or contextually close. For example, Facebook users will become friends with many users living in the same or nearby towns, attending the same university, or working in the same organization. If this user suddenly helps someone living on another continent and communicates with them, then this user may be malicious, and these features are called proximity concepts. Public OSN, such as Facebook, defines these features by grouping users into networks. The mapping of the proximity model described by the user's messages. If an account sends a message to someone in the same system, the message will be grouped as local information. Otherwise, when a user sends a message to someone in a different network, it is considered not local.
(5) Language
In OSN, users can freely transmit messages in any language. However, ordinary users will only use one or two common words to write notes. Therefore, this feature profile is relatively unchangeable (stable), and a sudden change in the user's language indicates that their activity has been maliciously changed. This article provides some features with inappropriate names, locations, and styles to determine the language used. It is usually difficult to describe the language of short messages with 140 characters (e.g., Twitter). Twitter messages are particularly problematic, mainly if messages frequently contain abbreviations or uncommon words.
(6) Message Text and Hobbies
Generally, OSN users send a large number of chat messages with ordinary information. However, suppose many users frequently discuss several topics, such as sports teams, favorite music, or online programs. The normal activity of users posting messages usually focuses on some favorite themes. If they suddenly send several different and unrelated matters, this new post should be marked as suspicious. It is usually very complex to map discussion topics from several text fragments without context. However, today's OSN applications enable users to explicitly mark issues and what their messages are talking about.
(7) Website Information
When a user posts a message on the OSN wall, it contains links to access additional resources such as blogs, images, videos, or news containing links. Previous work has explored URL analysis to determine whether a user message is suspicious. In this study, DeepProfile provides URL links as part of the user profile features. However, the study focuses on capturing the user's regular activities, and the model does not attempt to find out whether the URL itself is malicious. However, the model assumes whether the link is different from the expected behavior of a specific user. Using the domain name in the URL link to simulate the use of links in the message posting. Extracting complex techniques (natural language processing) for URL links is reasonable. However, such research is beyond the scope of this work.
(8) Profile Picture
Capturing a user's profile image is a technique to confirm whether an account is normal or has been compromised. For example, the normal activity of a female account is displayed by showing her photo in any style. If the profile image suddenly changes to a male photo or other unrelated items, it should be rated as suspicious. The model acquires the profile image as a feature to learn the typical behavior of users, and if malicious users do not match the learned user profile, they are marked as possible compromises.
0x03 Model
A. Learning Patterns
Diverse research has proposed different methods, including rule-based, statistical, and traditional machine learning algorithms. This study does not use a standard model but focuses on supervised learning to build a new model for fake profile detection. Supervised learning is more suitable for classification tasks such as fake profile issues. Assuming that fake accounts are not as typical as robots, the possibility of proper classification using unsupervised learning models is relatively low.
Supervised learning is established to train labeled features as input matrices to predict results. These features describe information about certain OSN accounts, such as name, gender, number of friends, number of links, etc. In most cases, deep learning algorithms obtain features known as engineering features. Typically, features are a combination of engineering elements and attributes. In OSN research, engineering features are divided into three different categories: account identity, relationships between each other, and account behavior. The study uses combinations of several features as datasets.
One of the reasons for choosing deep learning as a model is the automatic representation of a set of highly nonlinear functions. It can be a method for automatic feature learning across different applications, including image classification, language modeling, and information retrieval. In addition, it is a general-purpose model that can reduce the trouble of adapting to new applications, and they can generalize well to unseen data.
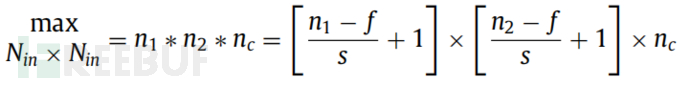
B. CNN architecture
CNN is mainly composed of three layers: input layer, hidden layer, and output layer. A common CNN uses the input layer to extract and project text into a matrix input. In the input layer, the network layer extracts features and projects them into a matrix input. To calculate the result of feature extraction, a convolutional layer with weight sharing is used to process. Convolution is processed between the filter and the input matrix to convolve a set of filters in the form k ∈ R^(d × m) with the input matrix M ∈ R^(d × |s|). The goal of the convolutional layer is to calculate feature extraction. Typically, CNN implements weight sharing to reduce the number of parameters in the network. Therefore, it is not necessary to optimize many parameters, as this method can build convergence faster. In addition, a wide convolution between window filters is used to estimate the best local features in each layer.
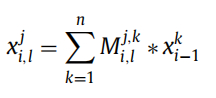
On the other hand, convolution can handle multiple input feature maps to produce stacked feature maps of increasing layers. In convolution operations, the feature map of the i-th layer is defined as xi, and j parameters represent the index of the feature mapping in the i-th layer:
The model not only performs convolution operations but also collects the values with the largest information content in the hidden units. Typically, a CNN performs this operation repeatedly on tens of layers. In this process, it applies the learning of each layer to detect different aspects of the CNN network. In the last layer, a fully connected (FC, Fully Connected) layer is constructed to calculate the output of the vector K (number of classes). In the final stage, a SoftMax function is provided to reduce the noise signal in the fully connected layer, and then generate the accuracy and loss of the neural network. The classifier is calculated by the following function:
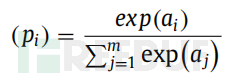
The above function has class probability p ∈ [0, 1]^n and ∑pi = 1. The output of SoftMax is represented as logits. However, when the number of classes n is large, using the complete SoftMax for learning is expensive. Therefore, the observation of SoftMax is becoming a research field to improve the performance of fully connected layer classifiers.
C. Dynamic CNN
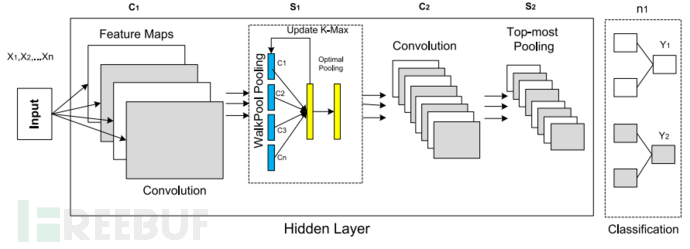
In this paper, a dynamic CNN is proposed by introducing WalkPool. WalkPool is a novel pooling layer in the hidden layer, used for training NN in classification tasks. It is a random pooling paradigm in neural networks, which utilizes network parameters to obtain pooling values. In principle, pooling simplifies the output features by performing nonlinear calculations and reducing the number of parameters. It is to obtain an appropriate feature map width of the intermediate layer. A k-max pooling function is calculated to establish the WalkPool pooling to obtain the pooling parameter k corresponding to the network. The following figure describes the calculation process of the DeepProfile CNN hidden layer.
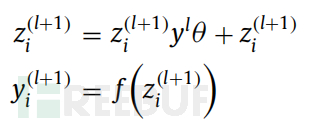
Construct functions to allow smooth extraction of higher-order elements and adapt to longer ranges. The model achieves this by utilizing the pooling parameter k in the hidden layer to adopt the k value, which is a dynamic value that can extract higher-order and longer features. The basic operation of the proposed CNN is the simultaneous backward and forward propagation in one iteration. The dynamic CNN calculates the forward propagation using the following function:
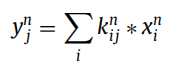
In the above formula, the first network calculates the feature mapping as the input layer of the dynamic CNN. The dynamic CNN calculates the backward propagation using the following formula:
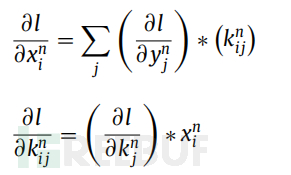
During the backward propagation process, this layer calculates the gradient of the loss function l with respect to xni. The gradient values obtained by the partial derivative function ∂l/(∂(x,ni)) are passed to the first layer of the network. Then, the gradient of the loss function with respect to k(n,ij) is calculated.
To obtain the loss function, the CNN traverses all neurons from the first layer to the last layer. The backward propagation of CNN refers to the reverse propagation of the error of the gradient descent calculation of the loss function with respect to the network parameters (weights and biases). To obtain the minimum loss function, gradient descent technology needs to be used to update the learning parameters. In this paper, the cross-entropy (CE, Cross-Entropy) loss function is adopted, which is mainly the loss function for classification problems, and is calculated by:
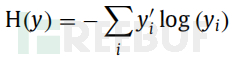
On the above function, y‘i is the target label, and yi is the output of the classifier. The CE function is used to obtain the probability distribution output, which is the preferred loss function for SoftMax.
In this paper, a CNN architecture is constructed, and the attributes are calculated as input features through forward and backward operations. The focus of this study is on how to establish a pooling layer to optimize the neural network. Therefore, the k-max pooling concept is adopted to construct the function. Essentially, in the common k-max pooling concept, it requires a value k and a sequence p ∈ R^p with a length of p ≥ k. Then, in the p sequence, k-max pooling selects the subsequence p(k,max) of the k highest values of p. The value order in p(k,max) refers to their original order in p. Therefore, the k most active features in p that may be separated by multiple positions can be pooled. However, since the value of k is static (fixed), it is challenging to smoothly extract high-order and long-distance features.
To optimize the performance of CNN during the training process, the concept of dynamic k max pooling is used to construct the CNN. This paper designs the WalkPool pool instead of using the common Max-pooling to obtain the most important value in the filter, which is a dynamic pooling operation that can obtain the most appropriate value at each pooling layer. The main idea of WalkPool is to utilize dynamic k-max pooling to extract suitable feature maps in the neural network. The pooling parameter k can be dynamically selected by making k a function of other aspects of the network. It retrieves k maximum values from the pooling window. The following figure illustrates the CNN with WalkPool pooling features.
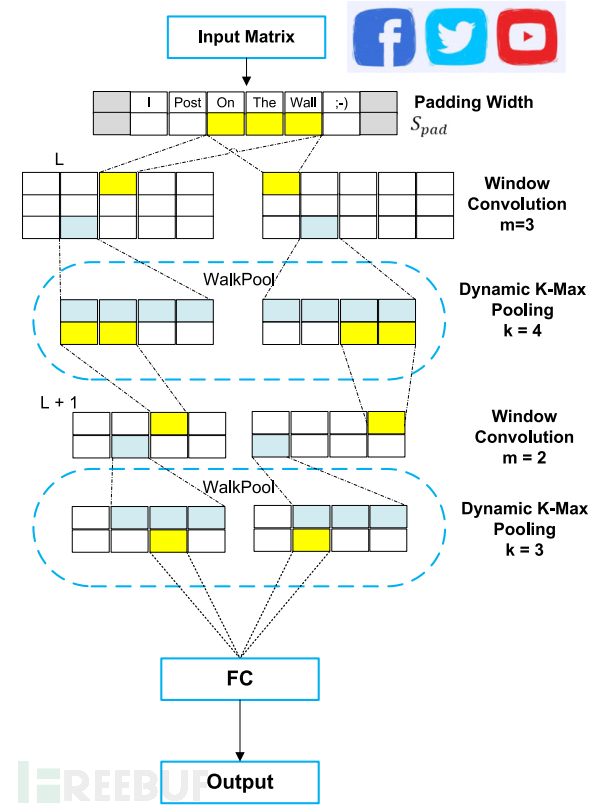
The figure above depicts the CNN architecture with suggested pooling. It consists of three layers, including the input layer, hidden layer, and output layer. In the input layer, the model converts all features into vector values and then inputs them into the model. The hidden layer runs the convolution process using filters, where the input matrix M ∈ R^(d × |s|) is convolved using a set of filters in the form k ∈ R^(d × m). The convolutional layer is designed to calculate feature extraction throughout the training process. The convolutional layer runs feature extraction on the input data to capture better representations in the hidden layer.
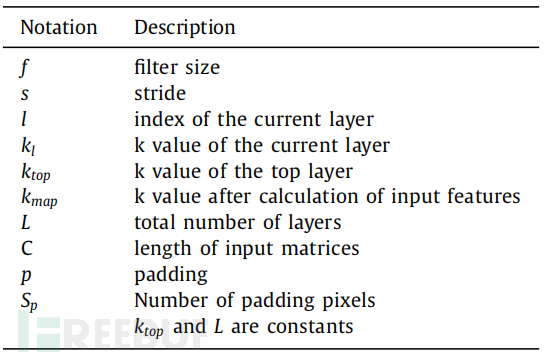
WalkPool function:Assuming k is a function of the length of the network input matrix, and l is some current convolution in the hidden layer. To construct the function, L is required as the total number of convolutional layers, ktop is the fixed maximum pooling parameter of the topmost convolutional layer, and Sp is the padding number. The following table describes the mathematical symbols of WalkPool.
The CNN model calculates pooling in input data using the following methods:
This study constructs a function to obtain appropriate K-Max pooling values by using more layers with dynamic value parameters. During the forward propagation, the N × N pooling part will produce a single 'winning unit' value. To obtain the value of each layer, a new function is constructed instead of selecting the maximum value from l layers. Therefore, a simple pooling function is calculated to obtain 'dynamic winning out' to obtain the layer lThe k value of kl. To obtain the kl value, the following function is used to calculate kmap:
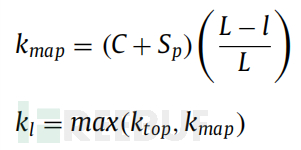
The WalkPool function obtains the pooling value kl by comparing the scores between ktop and kmap in each pooling layer. The value of ktop is constant, and the value of kmap is determined by the network parameters. The basic idea of the function is how to calculate network elements to determine the value of k to find the appropriate k maximum value. The model uses wide convolutions in each window to ensure that all weights receive the entire parameter action.
WalkPool runs by dynamically changing the values of the pooling layer to obtain the feature map with the highest information content in the CNN hidden layer. It does not use linear values in the network, but calculates the length of the input matrix based on dynamic parameters. It is a CNN hierarchical structure that recalculates the graph and learns the feature sequence using a fixed number of layers. To calculate the kmap value, the function gets the current convolution represented by the lth layer, L is the total number of convolution layers, and ktop is the fixed maximum pooling parameter of the topmost convolution layer. To obtain the pooling value, the following algorithm is used to calculate the WalkPool function.
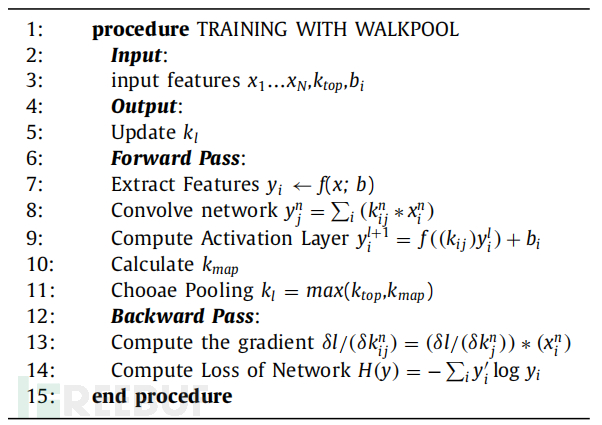
The algorithm describes how to calculate network parameters to achieve the optimal pooling value. WalkPool tries to find the appropriate k-max value based on the current CNN parameters. It uses the parameter k to obtain the optimal k-max pooling value. In the dynamic view, the model can dynamically select the pooling parameter k. The k function is obtained from the input side of the network. This function calculates the pooling window by changing the length of the vector to the same length. The model activates the features between the convolutions and before the fully connected layer (FC, Fully Connected).
The main idea of WalkPool is to modify the common K-Max pooling operation by providing a dynamic k-max pooling that respects network parameters. The WalkPool function is constructed to calculate hidden layer parameters to obtain appropriate pooling values and obtain appropriate feature maps. In the function, the pooling parameter k can be dynamically selected by making k a function of other aspects of the network to retrieve the k value from the pooling window. The model provides pooling features between hidden layers before the fully connected layer.
0x04 Experimental Setup
A. Dataset
This study collects and extracts many personal profile features to construct a benchmark dataset. The sample includes identity, full name, number of friends, number of followers, time, language, link or URL, message samples, and profile images. Before the training process, the dataset is divided into training and test datasets. In order to achieve good results in the training and testing processes, this paper provides a large OSN as a dataset, which contains labeled data with both benign and false targets. By using OSN attributes as model inputs, the vector data of user profiles is input into the learning model.
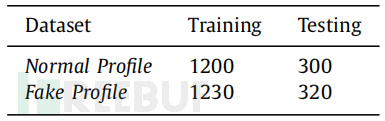
In this study, a dataset of OSN personal profiles with more than 3000 unique users was collected. The dataset was constructed by decomposing many profile information. For the experiment, this paper observed the user features of 3000 OSN members. This paper provides 1500 samples with normal labels and 1500 fake profile labels. To achieve the best accuracy and the least loss, the data were separated from each other. In this experiment, the model trained the learning model to obtain the best results by adjusting the CNN hyperparameters. By training explicit OSN features, the learning model can be trained on sparse data. The table above shows the dataset information of the experiment. The benchmark dataset provides the basic features representing the interaction environment of OSN. The table below shows the high configuration information used for training and testing the DeepProfile classifier.
B. Data Preprocessing
For preprocessing, the model acquires multiple OSN features generated by the user, including identity number, full name, number of friends, number of followers, language, location, message topic, URL links, profile and background images. These features represent the frequency of patterns in the personal profiles of cluster users. Data preprocessing converts all input samples into numerical arrays. Then, it inputs the array into the neural network for the training and testing process. It is important to calculate the features composed of explicit and implicit features on OSN during the learning process. Explicit features are widely used original user metadata in different studies, such as information credibility classification and user identity linking. Implicit features are not directly provided in the profile. They usually help represent the user profiles for specific tasks. Features such as age, gender, or personality are standard implicit identity features. In this study, explicit features were collected and provided to the model to train the classifier model for malicious account classification.
At this stage, create data labels to distinguish fake and false personal profiles. Before inputting features into the learning model, it is necessary to convert all specific features into a set of numerical vectors. The model calculates the input vector after converting features into byte representation values. The feature extraction process is of great significance for the quality of training data in support learning problems. The dataset is divided into two parts to ensure the performance of the model in the training and testing processes with unseen data. To allow for training computation, the dataset is provided as a table in a two-dimensional data grid. The rows of the table correspond to individual elements, and the columns reflect the number of these parts. The number of rows is called n_samples, and the number of columns is called n_features. The experiment introduces the feature matrix and the target array. The feature matrix (parameter x) represents a two-dimensional numerical array or matrix in the form of [n_samples, n_features]. This work also utilizes a one-dimensional target array (parameter y). Before feeding into the classifier, features and targets should be numerical arrays.
To train the model, this paper constructs a classifier to calculate OSN features and adjust the hyperparameters in the hidden layer to optimize network parameters to improve NN performance. It is effective in handling the high dimensionality of raw data. The research also provides evaluation metrics to estimate the generalization degree of CNN to datasets outside the data set. Due to its speed and simplicity, it is adopted to evaluate the performance of the DeepProfile model on samples.
C. Avoiding Overfitting
The computational graph of neural networks is very complex, and the main problem of ML algorithms is the tension between optimization and generalization. During the training process, optimization is the process of adjusting the model to achieve the best performance. Generalization reflects the ability of the trained model to handle overfitting on unseen data during the training process. In CNN models, both overfitting and underfitting can lead to a decrease in the performance of DL models. Underfitting is the situation where the model produces poor performance on the training data and has poor generalization to other data. However, the most common problem in DL training is overfitting. Overfitting produces good performance on the training data, but it has poor generalization ability to other data.
The complexity of this network and the limitations of training data lead to NN being more prone to overfitting. Therefore, it requires a mechanism to slightly modify the learning algorithm. To allow the network to adapt to the data, regulization is implemented. It helps to avoid overfitting when training neural networks. The role of the hidden units is to effectively approximate a function from the data set that can be generalized to unseen data. The algorithm needs to penalize the weight matrix of complex nodes.
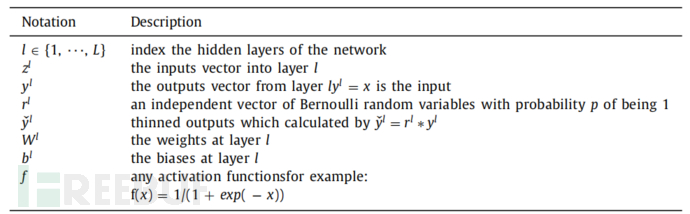
In this study, the regulizer method is applied to obtain effective training in social network datasets. The main idea of the regulizer is to randomly set some weights in the given layer to zero. By using regulizer, the weights of the nodes in the hidden layer become less sensitive to the weights of other nodes, and learn to decide the result independently of other neurons. Randomly closing some hidden units makes the hidden units do not need to learn each unnecessary detail of the instances in the training set. This operation uses deletion features for each hidden element. It is the process of generating a refined network structure. The table above describes the mathematical symbols of regulizer. Functionally, consider a network with L hidden layers. In standard feedforward, for l ∈ {0, ..., L - 1}, calculate:
The regularizer calculates the ytrain training process for input x and Bernoulli probability p and other parameters. In the forward operation, the regularizer with Bernoulli probability is implemented using the following formula:
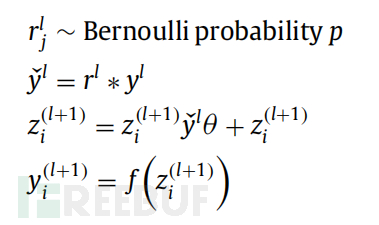
To calculate the next layer, the regularizer uses the refined output y(i, (l+1)) as new input. This process is applied to each layer in the hidden layer. This quantity is sampled from a larger network to build a subnetwork. During training, it propagates the derivative of the loss function through the subnetwork. During testing, the weights are multiplied by p and the weights are scaled to W(l) test = pW(l), so the unit always exists.
D. Classification Process
The supervised learning model is constructed as binary classification to classify between malicious or normal profiles. Before inputting the input matrix, the array should be converted to a binary tensor to establish adaptability on the network. In the initial steps, the proposed CNN adopts a set of input data and crosses it to the hidden layer. In the initial stage, the network receives OSN features as the input matrix.
To generate output, the network performs convolution, pooling operations, and calculates the fully connected layer. The goal of the convolutional layer is to obtain numerical features by sliding a filter (a smaller matrix) over the input data. However, the convolution process generates large arrays. To simplify the array, a new pooling function is implemented to maximize the pooling operation. Pooling is used to reduce the feature map, and information with the largest content is retained by utilizing the downsampling technique to avoid overfitting in CNN.
In the hidden layer, the model is trained by providing several hidden layers to measure the depth performance of the CNN activation layer. In this paper, the automatic weight sharing feature is adjusted to reduce the number of parameters and improve the generalization ability of the network. The shared weights of neurons are a method to avoid overfitting by reducing the degrees of freedom of the network complexity. This method can build convergence faster, so it is not necessary to optimize many parameters in the neural network.
In the pooling layer, the proposed pooling function was tested as a pooling function on CNN. The CNN with WalkPool pooling optimizes the network performance in classification tasks using general functions. It is similar to the concept of adaptive maximum pooling, where the value of the k maximum pooling parameter can be dynamic. By selecting and calculating network parameters, the appropriate pooling value is obtained by comparing the scalar k.
0x05 Results
A. Classification Test
In order to classify the categories of user profiles, the DeepProfile model was tested with different learning parameters. During training, some famous optimizers were checked, including momentum-based stochastic gradient descent (SGD), Adam, Adagrad, and RMSprop. The loss gradient was calculated during the critical part of training the network to measure the efficiency results between the training and testing stages. The concept of local variables was also implemented to calculate the loss function. The loss gradient of weights under different learning rates was calculated.
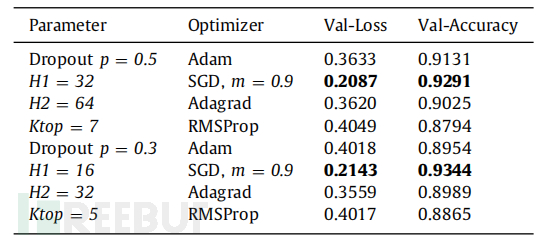
In this experiment, a balance between accuracy and execution time has been achieved. Different hyperparameters have been tested to gradient descent and adjust the optimization algorithm. Choosing a value for hyperparameters is one of the most important parts to improve the quality of network training. By optimizing the hyperparameters, the highest performance of the network has been obtained. During the training and testing process, epoch = 15 and batch size = 50 have been adjusted. The table above describes the performance of DeepProfile CNN in calculating validation accuracy and loss. Several optimizers with different numbers of hidden layers have been trained to train the proposed CNN, by optimizing the gradient descent to minimize the objective function j(θ) and the model parameters θ ∈ R^d. The model updates the settings in the opposite direction of the gradient of the objective function ∇θj(θ). This study sets the learning rate η to determine the step size to reach (local) minimum maximum values. During the training and testing process, the best accuracy and small loss were obtained when training the model with SGD+momentum. The following figure shows the accuracy and loss of the proposed CNN trained with the SGD optimizer.
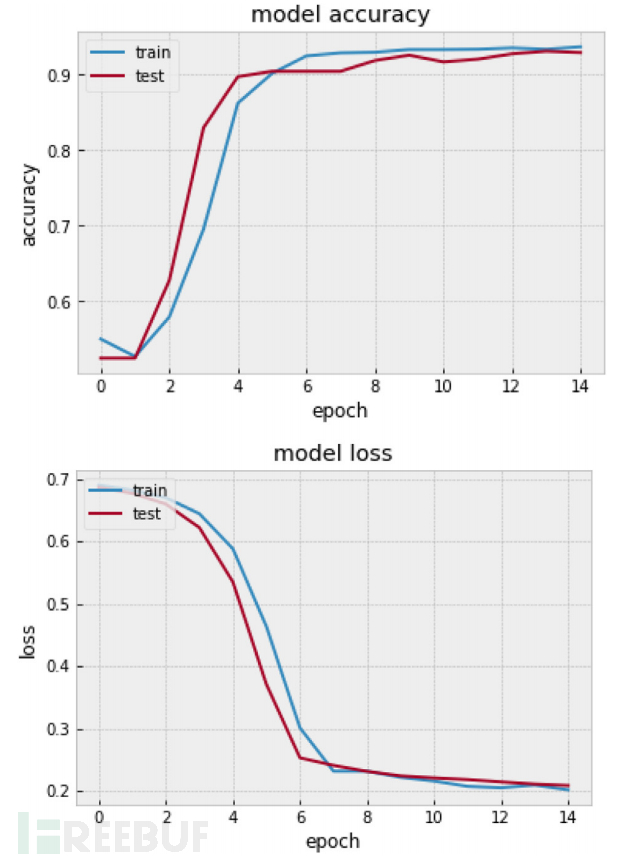
By using two convolutional layers and two fully connected hidden layers, the best architecture in DeepProfile CNN has been achieved. The best results in the neural network have been realized by using the SGD gradient descent with momentum m = 0.9. In the convolutional layer, ReLU and Sigmoid are combined as activation functions. It is noteworthy that the change of Ktop value in the WalkPool pool can improve the accuracy of the classifier. The results show that the momentum SGD with a smaller Ktop value produces the most effective results. By calculating the network elements of each layer, the WalkPool function can optimize the performance of the neural network, because this function selects an appropriate pooling value at each layer according to some parameters on the CNN. Therefore, it produces relatively higher accuracy than traditional machine learning algorithms. It is noteworthy that having more layers with a large number of neurons does not improve the predictive ability. Due to the limitation of the number of neurons, it can expand the computational resources. This study calculates OSN features as a dataset to test the usefulness of dynamic CNN. By simulation, an accurate balance between accuracy and loss has been achieved. The DeepProfile network can obtain accurate results through diverse input vectors. Experimental results show that the classification accuracy can reach a very high level, with very small loss. It is noteworthy that this model not only produces high efficiency but also runs the graphics with better performance.
B. Comparison Test
In this part, the comparative results of WalkPool Pooling, Max pooling, and Average pooling under the same hyperparameter tuning and environment are provided. The accuracy of the neural network is calculated in combination with the pooling function to illustrate the performance of each pooling in classification tasks. The table below shows the comparative results of different pooling functions when inputting 2400 training samples and 620 validation samples.
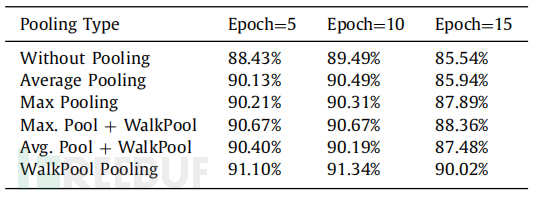
In the first experiment, the study trained the CNN model without a pooling layer, which means that the CNN replaces the pooling layer with convolution and stride. However, CNN without pooling cannot produce good accuracy in several epochs. In this case, the CNN needs a pooling layer to reduce the dimension of the output features and present a certain degree of invariance. According to the training results, CNN with pooling layer is better than that without pooling layer. To ensure the performance between WalkPool pooling, Max Pooling, and Average Pooling, the pooling layer is added to the CNN. It is well known that maximum pooling and average pooling are deterministic pooling types, which obtain pooling values based on the maximum and average scores of the pooling window. Instead of using ordinary deterministic pooling, WalkPool is tested as a random pooling to train CNN models in classification tasks. The experiment shows that the proposed CNN with WalkPool Pooling can achieve hopeful accuracy in the classification of fake accounts. However, when the training exceeds 13 iterations, the accuracy of the experiment will decrease. This can be solved by providing more datasets to train the model.
C. Evaluation Indicators
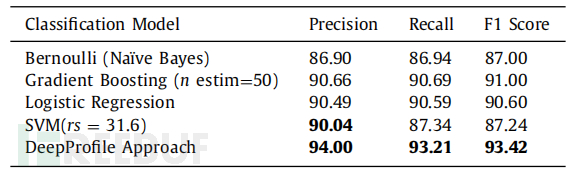
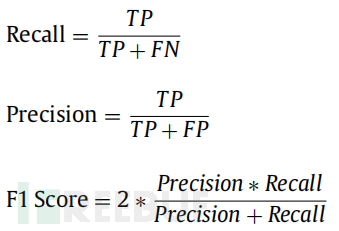
This experiment provides an evaluation of the performance model by using cross-validation. It is used to measure sensitivity, specificity, and accuracy. The evaluation of the model calculates the false positive rate (FP), true positive (TP), true negative (TN), and false negative (FN). The study conducted a performance evaluation to assess the performance of DeepProfile. The experiment evaluates the performance model by calculating the recall rate, precision, F1 score, ROC, and confusion matrix using cross-validation. The table above shows the recall rate, precision, and F1 score of several algorithms. The following function is used to calculate the indicators:
This experiment also plotted ROC and AUC to estimate the sensitivity and specificity of various thresholds without actually changing the threshold. DeepProfile adopts binary classification in the classifier. It needs to convert the output to binary values to extend the ROC curve. It is very useful for classification context. It is the relative operating characteristic curve with the change of standards (TPR and FPR). ROC plots the performance of binary classification. In the curve, the area with a value of 0.5 reflects that the model is as good as randomness. The following figure describes the ROC comparison of some supervised learning algorithms and DeepProfile in binary classification tasks.
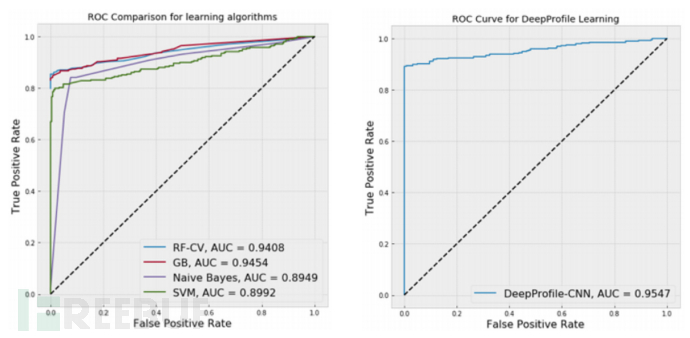
The experiment results show AUC = 0.9547, which means that the value in this area is valuable in the measurement evaluation. AUC runs by measuring the ranking based on two classes, which reflects the model's ability to distinguish between positive and negative classes. As shown above, DeepProfile achieves good level prediction because it produces AUC = 0.9547 and is superior to other traditional learning methods.
To summarize the learning techniques proposed in the OSN protection strategy, the proposed scheme can become a prospective choice for account analysis in massive data sets. Another advantage of this method is that it reduces the research and development cost of malicious account analysis. This study finds that the proposed model can not only achieve effective results, but also the neural network can execute better accuracy. In actual cases, CNN is a prospective choice for dealing with OSN malicious activities.
0x06 Conclusion
To address the issue of account anomalies, previous methods have proposed statistical techniques and learning algorithms with manual feature engineering. However, feature engineering and computational resources are expensive. This paper does not use ordinary learning but proposes DeepProfile, a model with a novel CNN that has universal pooling features to handle false profile classification. This method optimizes CNN computation and improves accuracy by using the WalkPool pooling layer, thus establishing a dynamic CNN architecture.
Reference link:https://www.sciencedirect.com/science/article/pii/S2214212619303801

评论已关闭