1. Background
1.1. What is Java memory horse?
Memory horse is a malicious program that runs only in memory without leaving any files on the disk, thus it has strong stealthiness and can bypass conventional file system-based detection. Java memory horse is designed for the Java language, which takes advantage of the dynamic features of the Java language, such as class loading mechanism, dynamic proxy, and reflection technology, to inject malicious code into the memory of Java applications, thereby achieving remote control.
1.2. Java Class Loading Mechanism
The class loading mechanism of the Java Virtual Machine (JVM) dynamically loads classes according to needs at runtime, rather than loading all classes at once when starting. Classes can be loaded from different sources at runtime, such as local file systems, remote networks, or other custom locations. Attackers can take advantage of this feature to load malicious classes at runtime, thus introducing untrusted code into memory.
1.3. The Necessity of Memory Horse Detection
In recent years, due to its characteristics such as persistence, concealment, and strong compatibility, memory horses have been widely used by attackers in various complex attack scenarios. Memory horses bypass file system monitoring by residing in memory, making it difficult for traditional antivirus software and intrusion detection systems to detect their traces. Therefore, it is necessary to study special memory horse detection technology to detect and eliminate the security threats brought by memory horses in a timely manner, thus ensuring the security of the system.
2. Detection
Memory detection of Java programs is generally carried out based on the dimension of Class bytecode, which is simply divided into two steps:
- Read Class information from memory
- Analyze and detect Class information
Detection Outline:
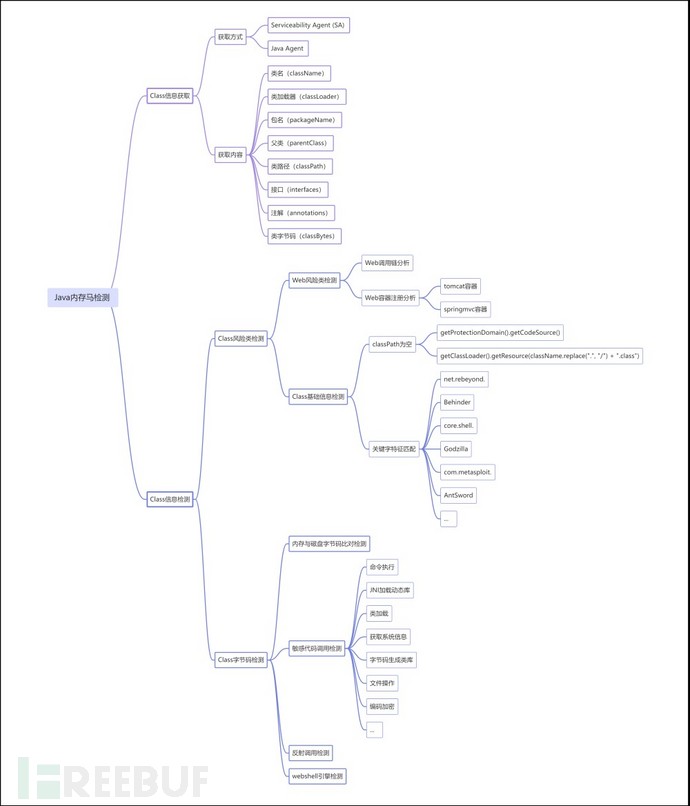
2.1. Acquisition of Class Information
2.1.1. Acquisition Method
2.1.1.1. Serviceability Agent (SA)
SA is a powerful debugging toolset provided by JDK, suitable for language layer and virtual machine layer, supporting debugging running Java processes, core files, and dump files after virtual machine crash. SA runs in a separate process and is isolated from the target Java process. When using SA tools, no code will be executed in the target Java process, but, during the process of reading data by SA, the target Java process will be suspended.
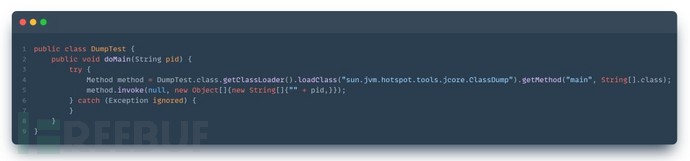
By receiving the process ID through the method of sun.jvm.hotspot.tools.jcore.ClassDump class in sa-jdi.jar, it can read out all the loaded classes of the corresponding process.
Code example:
2.1.1.2. Java Agent
Java Agent is a mechanism based on the Java Instrumentation API that can be used to dynamically modify the bytecode of a Java application at runtime. Java Agent provides two main methods:
- premain: Loaded before the Java process starts. This method can insert custom bytecode operation logic before actual class loading.
- agentmain: Loaded after the Java process starts. This method can operate on loaded classes at runtime, such as reading, modifying class bytecode, and other operations.
By using the VirtualMachine.attach(pid) method, the current process can be attached to the target JVM instance to achieve dynamic code injection.
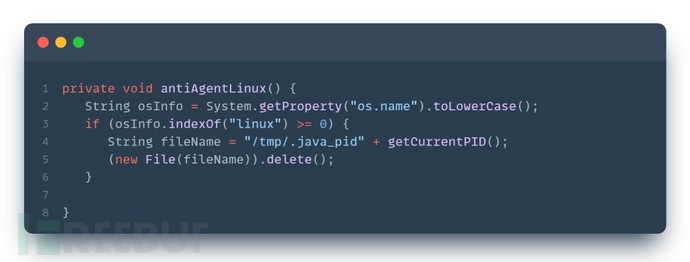
PS: The anti-detection function of the IceSword tool will delete the /tmp/.java_pid file, causing it to be unable to use attach for injection, and can be replaced by SA method.
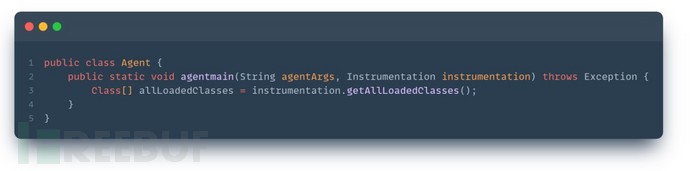
After normal attach, the agentmain method can be used to inject into another process to achieve memory information acquisition. Code example:
2.1.2. Content Acquisition
Obtain detailed information about Java classes, mainly focusing on the following fields:
- Class name (className): Obtain the full name of the class loaded in memory, which is helpful for identifying and tracking potential malicious classes.
- Class loader (classLoader): Obtain the class loader responsible for loading the class, to understand its loading source and identify abnormal or unusual loading behavior.
- Package name (packageName): Obtain the package to which the class belongs, to help judge the organizational structure and potential risk areas of the class.
- Superclass (parentClass): Obtain the superclass of the class, analyze its inheritance relationship, to discover possible hidden malicious code.
- Class path (classPath): Obtain the location of the class in the file system, used to verify the legitimate source of the class and check for potential tampering signs.
- Interfaces (interfaces): Obtain all interfaces implemented by the class, understand its functionality and behavioral contracts, and detect abnormal interface implementations or malicious interfaces.
- Annotations (annotations): Obtain annotations on the class, identify metadata that may affect class behavior.
- Class bytecode (classBytes): Obtain the bytecode content of the class, deeply analyze its actual implementation, and identify possible malicious code or unexpected behavior.
2.2. Class Information Detection
The detection of the obtained Class information can be divided into two aspects:
- Firstly, filter the Class to identify risk classes.
- Detect the Class bytecode content of all classes or risk classes according to requirements.
2.2.1. Class Risk Class Detection
2.2.1.1. Web Risk Class Detection
Firstly, analyze potential web risk classes according to different types of memory horses
- Component-type memory horse: It is sufficient to analyze the corresponding Servlet, filter, Listener, and other components in memory.
- JSP memory horse: It is sufficient to analyze classes that implement HttpServlet in memory.
- Agent-type memory horse: Since the agent mechanism can almost rewrite any class in memory, there are many hook points, and the specific features need to be iteratively updated with the development of technology. Hook points are generally on the critical chain of web calls.
Although there are various types of memory horses, they usually act on the critical chain of web calls, triggering memory horses through web requests, and executing logic through request parameters.
1) Web Call Chain Analysis:
哪些调用链是Web调用的关键链路?
Which call chains are the key chains of Web calls?
Taking a SpringBoot Web project as an example, the call stack for processing Web requests is roughly as follows:
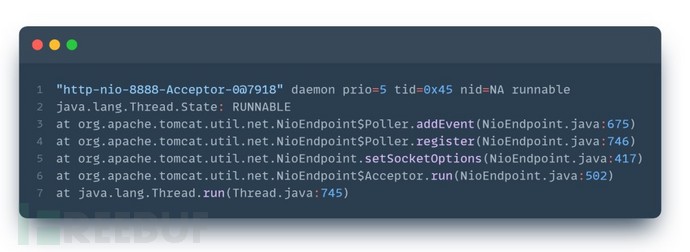
1. Tomcat establishes an HTTP connection and adds read and write event listeners:
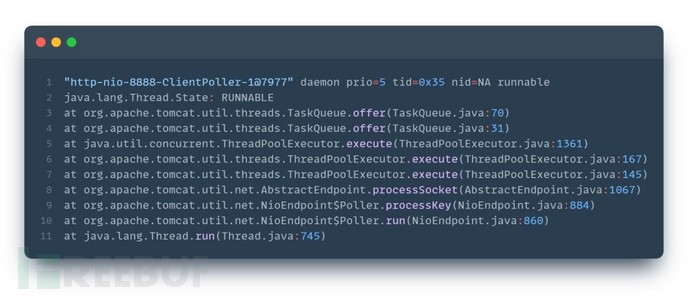
2. Tomcat receives the request data packet and puts it into the thread pool to process the data packet:
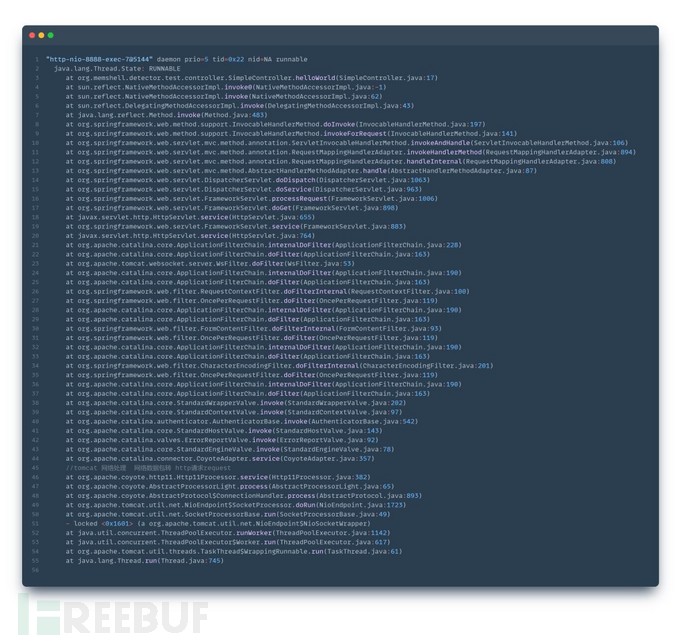
3. Tomcat actually processes the request data packet:
In practical application scenarios, the hook point is likely to occur after Tomcat actually processes the request data packet into an HTTP request request.
From the stack information, it can be seen that the call chain will pass through Tomcat's Valve component, the servlet's FilterChain and Filter component, the Servlet component, and the related processing of SpringMVC, and then execute to the Controller's helloworld method.
So, is it enough to focus on the above call chain?
Of course not, there will be other code logic in each method, and the actual Web call process will involve more classes than the above call chain.
2) Web container registration analysis
Why do we need to do Web container registration analysis?
When the Web framework handles Web calls, it is generally divided into two steps:
- Register components at program startup, that is, define when the Web program starts which component should be responsible for processing the received request.
- When the actual Web call occurs, the Web container finds the corresponding component to process according to the call information.
Therefore, we can read the registration components corresponding to the Web container class for memory analysis, which is more targeted and accurate.
Here, we introduce two of the most common Web containers: Tomcat and SpringMVC.
a) Tomcat container:
When using Tomcat as a Web container, the registration information of filter, servlet, and listener can be obtained through its core object StandardContext.
The process of obtaining is as follows:
- StandardContext --> filterConfigs, filterDefs --> filter
- StandardContext --> servletMappings, children --> servlet
- StandardContext --> applicationListeners, listeners --> listener
Valve is also a very important component in Tomcat, but Valve is an integrated component in Tomcat, and it is not usually customized. It only needs to implement the Valve interface through class judgment to filter.
On the other hand, filters, servlets, and listeners are open components provided by the servlet specification for developers to customize, which are more significant in further analysis through container registration.
b) springmvc container:
As the most common Web framework, the registration information of springmvc also has the value of targeted analysis.
The registration information to be obtained:
In springmvc, the main information obtained is the HandlerMethod object and HandlerInterceptor object.
- The HandlerMethod object registered in the container represents the actual handling method of the request, indicating the controller object and corresponding handling method in springmvc.
- The HandlerInterceptor in the container is an open interceptor, and springmvc provides a mechanism for custom processing before and after request handling.
How to obtain registration information:
First obtain the spring container component ApplicationContext, then obtain the core component DispatcherServlet of springmvc from it, and then obtain the registration information. The process of obtaining it is as follows:
- ApplicationContext --> DispatcherServlet --> List<HandlerMapping> handlerMappings --> AbstractHandlerMethodMapping.getHandlerMethods()
- ApplicationContext --> DispatcherServlet --> List<HandlerMapping> handlerMappings --> AbstractHandlerMapping.adaptedInterceptors
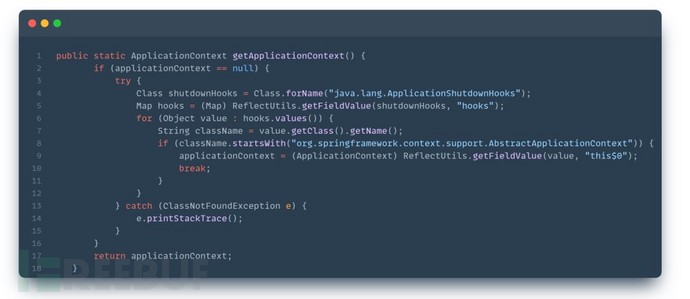
When actually obtaining the registration information of springmvc in the above manner, reflection may be used to obtain information, and it may be unknown where to obtain the most original ApplicationContext object, making it difficult to proceed.
The most original ApplicationContext object, generally needs to be obtained from the static variables of the class. The reference relationship of the ApplicationContext object can be analyzed through memory analysis to find the path of acquisition.
The following are examples of how to obtain it:
2.2.1.2. Class basic information detection
1) classPath is empty
By analyzing classes with an empty classPath, excluding known normal cases, the remaining classes are likely to be risk classes.
1. getProtectionDomain().getCodeSource() is null
This means that there is no associated code source information for the class. Possible reasons include:
- This class is a JVM built-in class (such as classes in java.*), because these classes are loaded by the JVM itself, and they do not have explicit code sources.
- This class is dynamically generated through bytecode operations or loaded in an unconventional way (such as through certain proxy classes or bytecode tools dynamically generated).
- This class is generated at runtime in Java, such as using Proxy, ClassLoader.defineClass() and other methods to generate classes.
2. getClassLoader().getResource(className.replace(".", "/") + ".class") is null
This means that the class loader cannot find the resource path corresponding to the specified class. Possible reasons include:
- The class is loaded by a specific class loader, but this class loader does not use the standard path search mechanism (such as URLClassLoader or a custom ClassLoader).
- This class is loaded directly from memory (such as through bytecode generation tools), rather than obtained from the file system or network resources, so the corresponding class file resources cannot be found.
- Due to security restrictions or other reasons, the class loader cannot access the actual storage location of the class.
2) Keyword feature matching
It is possible to identify malicious classes possibly created by memory horse generation tools by detecting whether suspicious keywords such as shell, exploit, etc. are contained in class basic information such as package name, class name, superclass name, class loader, etc.
- The package name of 冰蝎 starts with net.rebeyond. or contains Behinder keywords
- The package name of Godzilla starts with core.shell. or contains Godzilla keywords
- The package name of msf starts with com.metasploit.
- 蚁剑 contains AntSword keywords
- ...
2.2.2. Class bytecode detection
The method of identifying memory horses by detecting Class basic information only analyzes some superficial characteristics of Class, and its advantage lies in low consumption, but it is easy to be bypassed. The malicious code injected by memory horses must exist in memory as Class bytecode, and checking the Class bytecode content is a more direct way.
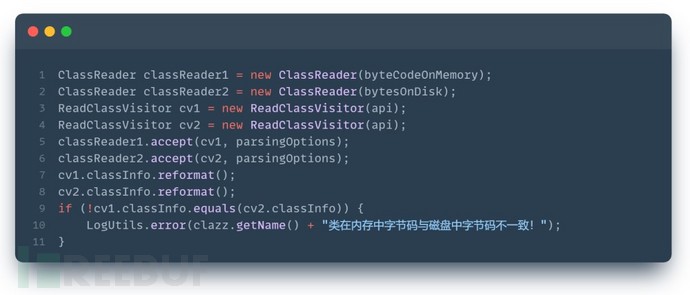
2.2.2.1. Comparison of Memory and Disk Bytecodes
Read the loaded bytecode information and compare it with the bytecode information on disk. If they are inconsistent, it is a suspicious class.
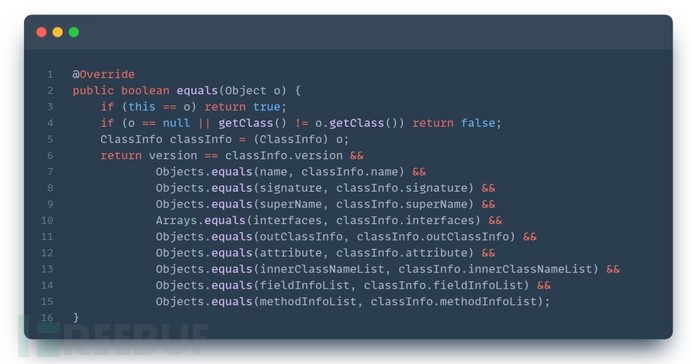
If the byte stream of Class is directly compared, false positives may occur frequently. ASM tools can be used to parse the Class content into properties and methods, and then compare each property and method.
Code example:
2.2.2.2. Detection of sensitive code calls
Use the ASM tool to parse the Class bytecode method and compare it with the sensitive code features
Highly sensitive code calls:
1. Command execution:
- java.lang.Runtime#exec
- java.lang.ProcessBuilder#start
- java.lang.UNIXProcess#forkAndExec
- ...
2. JNI dynamic library loading:
- java.lang.System#load
- java.lang.Runtime#load
- ...
3. Class loading:
- java.lang.ClassLoader#defineClass
- java.lang.reflect.Proxy#defineClass0
- sun.misc.Unsafe#defineAnonymousClass
- java.lang.invoke.MethodHandles.Lookup#defineHiddenClass
- ...
Other sensitive code calls:
- System information acquisition
- Bytecode generation class library
- File operations
- Encoding and encryption
- ...
2.2.2.3. Detection of reflection calls
Due to the open and dynamic characteristics of the Java language, sensitive code can be dynamically called through reflection and other methods, thus bypassing normal detection rules.
Reflection call methods:
- java.lang.reflect.Method#invoke
- sun.reflect.NativeMethodAccessorImpl#invoke
- jdk.internal.reflect.NativeMethodAccessorImpl#invoke0
- java.lang.invoke.LambdaMetafactory#metafactory
- java.lang.invoke.MethodHandle#invoke
- java.lang.invoke.MethodHandle#invokeExact
- java.lang.invoke.MethodHandle#invokeWithArguments
- ...
How to effectively detect reflection calls:
A master proposed using the simulation stack frame method for detection, but the simulation stack frame method has high overhead and can only limit the detection range to a single method. However, the reflection call parameters may be defined in other methods, or even in web request parameters, so it has certain limitations.
Due to the runtime determination characteristic of reflection, runtime detection can be used to modify bytecode,桩插在 reflection code before, to determine whether the reflection parameters hit the sensitive code call, and then issue an alarm.
2.2.2.4. Webshell engine detection
After the Class bytecode is decompiled into Java files, it is scanned by a mature Webshell detection engine. The decompiled Class files are regarded as ordinary source code for detection, and the core is still to identify potential Webshells. By this method, the existing detection technology is fully utilized to identify malicious behaviors hidden in memory or code, further improving the accuracy and efficiency of detection.
3. Summary
This article systematically lists the detection methods of Java memory horses, covering from the basic information of classes to the in-depth detection of bytecode. Through these methods, it can effectively identify memory horse attacks. According to different scenarios or requirements, a balance can be achieved between detection rate and performance overhead, and the appropriate detection method can be selected to achieve the best detection effect.
However, the essence of attack and defense confrontation is dynamic. With the continuous development of memory horse technology, new attack methods and technologies will emerge continuously, and the existing detection methods may also fail. Therefore, it is necessary to continuously update and adjust the detection strategy, track the latest attack trends and technological progress, and continuously collect and optimize the detection features to enhance the system's defense capabilities and reduce security risks.

评论已关闭