Preface
Suricatais a network traffic identification tool that uses community-created and user-definedsignaturessignature sets (rules) to check and process network traffic, and Suricata cantrigger alerts.
By default, Suricata will store the software logs in/var/log/suricataThe following is a basic introduction:

eve.json: One of the most detailed and useful log files of Suricata. The eve.json log format is JSON, recording event information generated by all installed detection engines and other modules, such as alerts, HTTP requests/responses, TLS handshakes, and SSH handshakes, etc. Each event includes important metadata, such as timestamps, traffic from which interface, event type, source/target IP and port, protocol, and application information, etc.eve.log:eve.jsonthe same, but in a single-line text format instead of JSON. This format may be more convenient if Suricata's other log aggregation systems are integrated.fast.logis a simple text format file that contains basic information about service requests and responses in network traffic, such as protocols, ports, source/target addresses, and event counts, etc. This makesfast.logUnlikeeve.jsonAs detailed, but can provide lightweight performance improvement when there is a large amount of traffic.stats.log: Contains data related to Suricata's own statistics, such as CPU utilization, memory usage, and the number of packets and traffic volume processed, which is usually used to monitor Suricata's own performance and health status.
The goal of this article is to import the eve logs generated by Suricata into es, and use kibana for visualization display, quick search, query, and analysis.
Basic configuration
In this actual environment, we use a dual network card server to deploy Suricata, and then configure the network traffic port mirroring of the core switch to the network card of the Suricata server for traffic detection.
Configuration requirements: The more traffic to be checked, the more resources need to be allocated to Suricata.
Here we plan to use a 4-core CPU and 16GB of memory, a 1T hard disk.
Prepare a machine with dual network cards, one network card is used to provideWeb services and background management, one network card is used to openCollect traffic in promiscuous mode for monitoring.
Configure the promiscuous mode of the monitoring network card
ifconfig
//Execute to view the network card name and MAC address, and determine which network card to monitor based on the MAC address
ifconfig ens224 promisc
//Select the network card to be used for monitoring and execute the check again
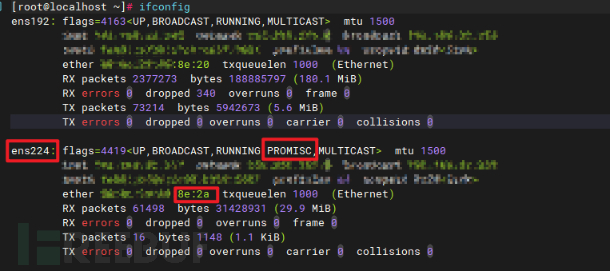
As shown in the figure above, we are preparing to use the ens224 network card for traffic monitoring. Then, find the network management and operation and maintenance big brother, tell him the network card MAC address, and ask him to help you open traffic mirroring to your monitoring network card.
Then, use a small tool to test the configuration results.
yum install dstat -y
//Install dstat
dstat -tnf
//Check the incoming and outgoing traffic size of two network cards, and evaluate whether the opening is successful based on the value
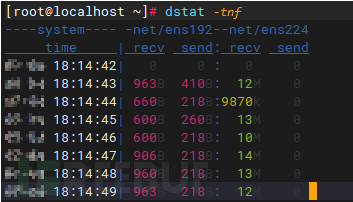
As shown in the figure above, we can see that the ens224 network card receives about 12MB of traffic per second, which can prove that our above configuration is effective.
Configure Suricata
Edit Suricata's configuration, change the network card name, and configure the network card that mirrors our traffic monitoring port./etc/suricata/suricata.yamlDetails please refer to the previous article
# Linux high speed capture support
af-packet:
  - interface: ens224
    # Number of receive threads. "auto" uses the number of cores
    #threads: auto
    # Default clusterid. AF_PACKET will load balance packets based on flow.
    cluster-id: 99
elastic stack configuration
To ensure consistency and stability of the environment, the latest elastic stack is deployed here using docker.elastic stack 8.7First, pull the image, create the docker internal network.
docker pull docker.elastic.co/elasticsearch/elasticsearch:8.7.0
docker network create elastic
docker pull docker.elastic.co/kibana/kibana:8.7.0
Start es and mount eve.json into the docker container.
docker run --name es-node01 --net elastic -d -v /var/log/suricata/eve.json:/var/log/suricata/eve.json -p 9200:9200 -p 9300:9300 -t docker.elastic.co/elasticsearch/elasticsearch:8.7.0
Start kibana
docker run --name kib-01 --net elastic -d -p 5601:5601 docker.elastic.co/kibana/kibana:8.7.0
Access the management network card's IPyour_ip:5601(https), here you need a secure token.
The previous Elasticsearch configuration did not enable any authentication. There are often data leakage issues. The latest es8.0 has enabled xpack by default, the configuration is a bit cumbersome, but the security has been greatly improved.
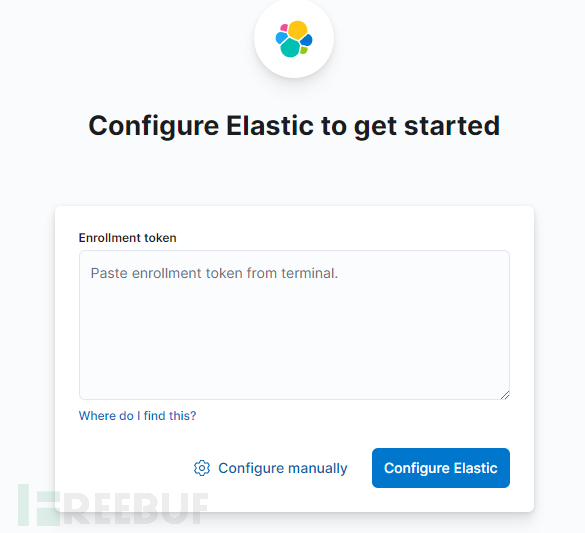
Host machine execution:docker exec -it es-node01 /usr/share/elasticsearch/bin/elasticsearch-create-enrollment-token -s kibanaEnter the echo, clickconfigure elastic
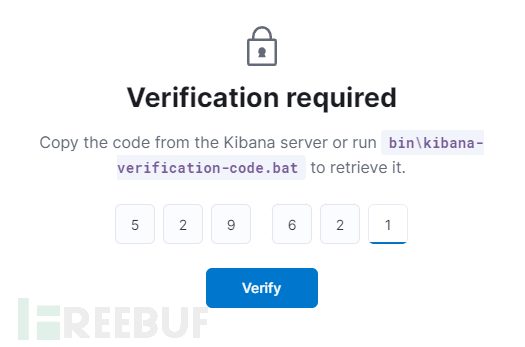
Then, you need to enter a 6-digit verification code, the host machine executesdocker logs kib-01Fill in the echo.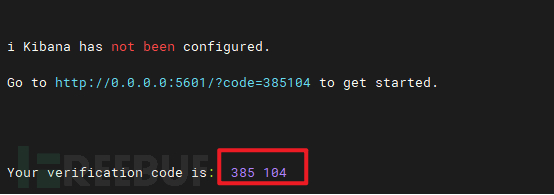
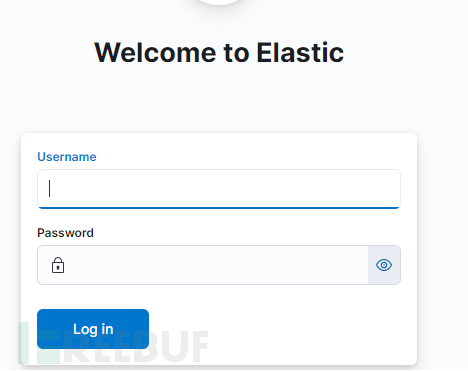
Then prompt for account and password
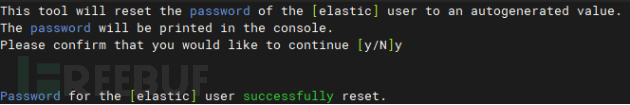
Execute on the host machinedocker exec -it es-node01 /usr/share/elasticsearch/bin/elasticsearch-reset-password -u elasticObtain the account and password, which needs to be remembered.
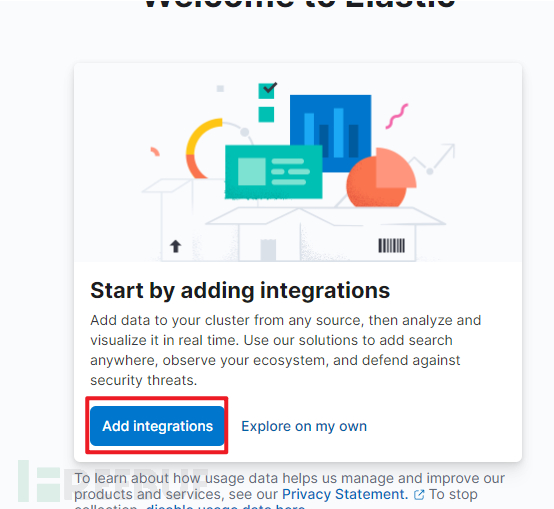
Log in and enter kibana.
Suricata联动es
Click to add data
Search for 'Suricata'
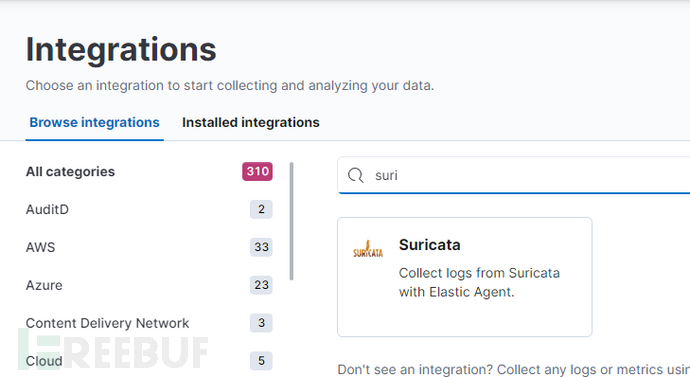
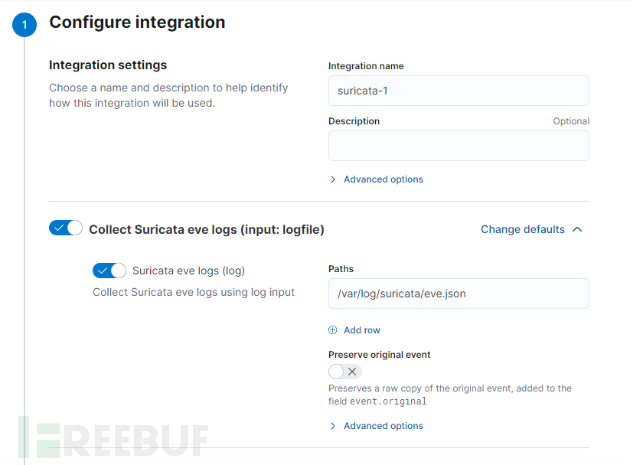
Here there is no need to change
Add agent, selectRun standalone, copy the long paragraph from the first stepAfter modifying the content of the configuration file, copy and keep it
hosts:
      - 'https://127.0.0.1:9200' // Modify to [Local machine:9200]
    ssl.ca_trusted_fingerprint: '7****************************3' // This line remains unchanged
    username: 'elastic' // Modify to the account obtained above
    password: 'Gxq*************qeaI' // Modify to the password obtained above
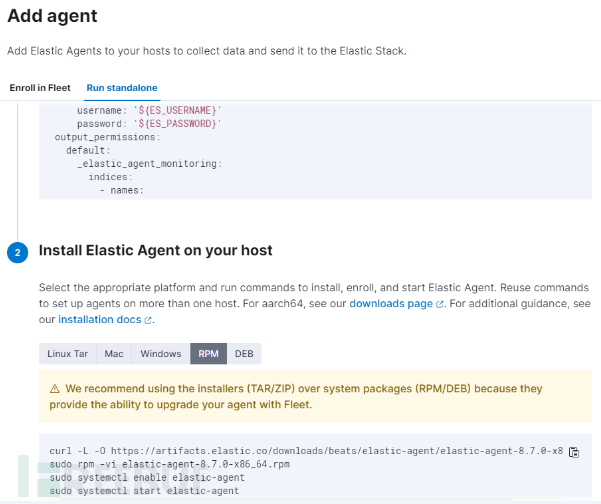
Execute according to the requirements on the host machine
curl -L -O https://artifacts.elastic.co/downloads/beats/elastic-agent/elastic-agent-8.7.0-x86_64.rpm
sudo rpm -vi elastic-agent-8.7.0-x86_64.rpm
sudo systemctl enable elastic-agent
sudo systemctl start elastic-agent
Replace the originalvim /etc/elastic-agent/elastic-agent.ymlBackup, copy the aboveContent of the configuration fileWrite all and save.
systemctl restart elastic-agent # Restart
systemctl status elastic-agent # Check the running status
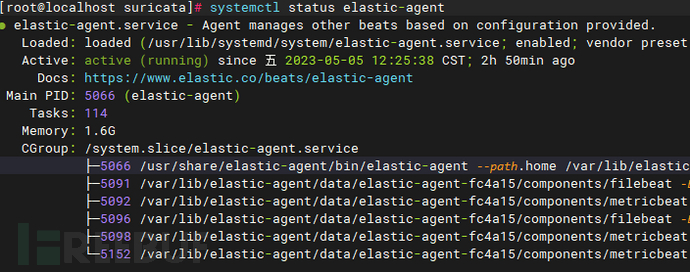
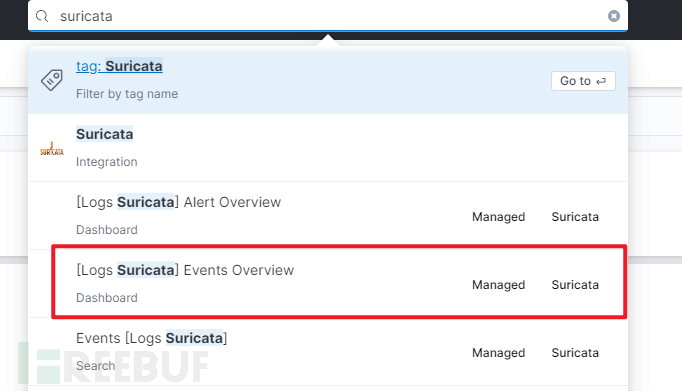
Then search for 'suricata' in kibana to view the dashboard
Then the configuration is complete. If there is little data, it may be due to small network traffic, agents needing time to transfer logs to es, and other reasons.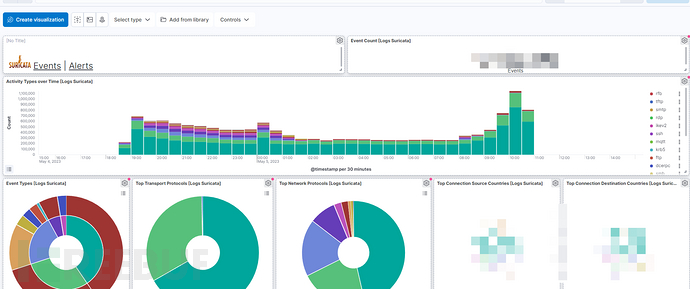
Subsequently, we will discuss how to optimize Suricata rules, add peripheral alarms, and draw dashboards with higher information density, among other content.

评论已关闭